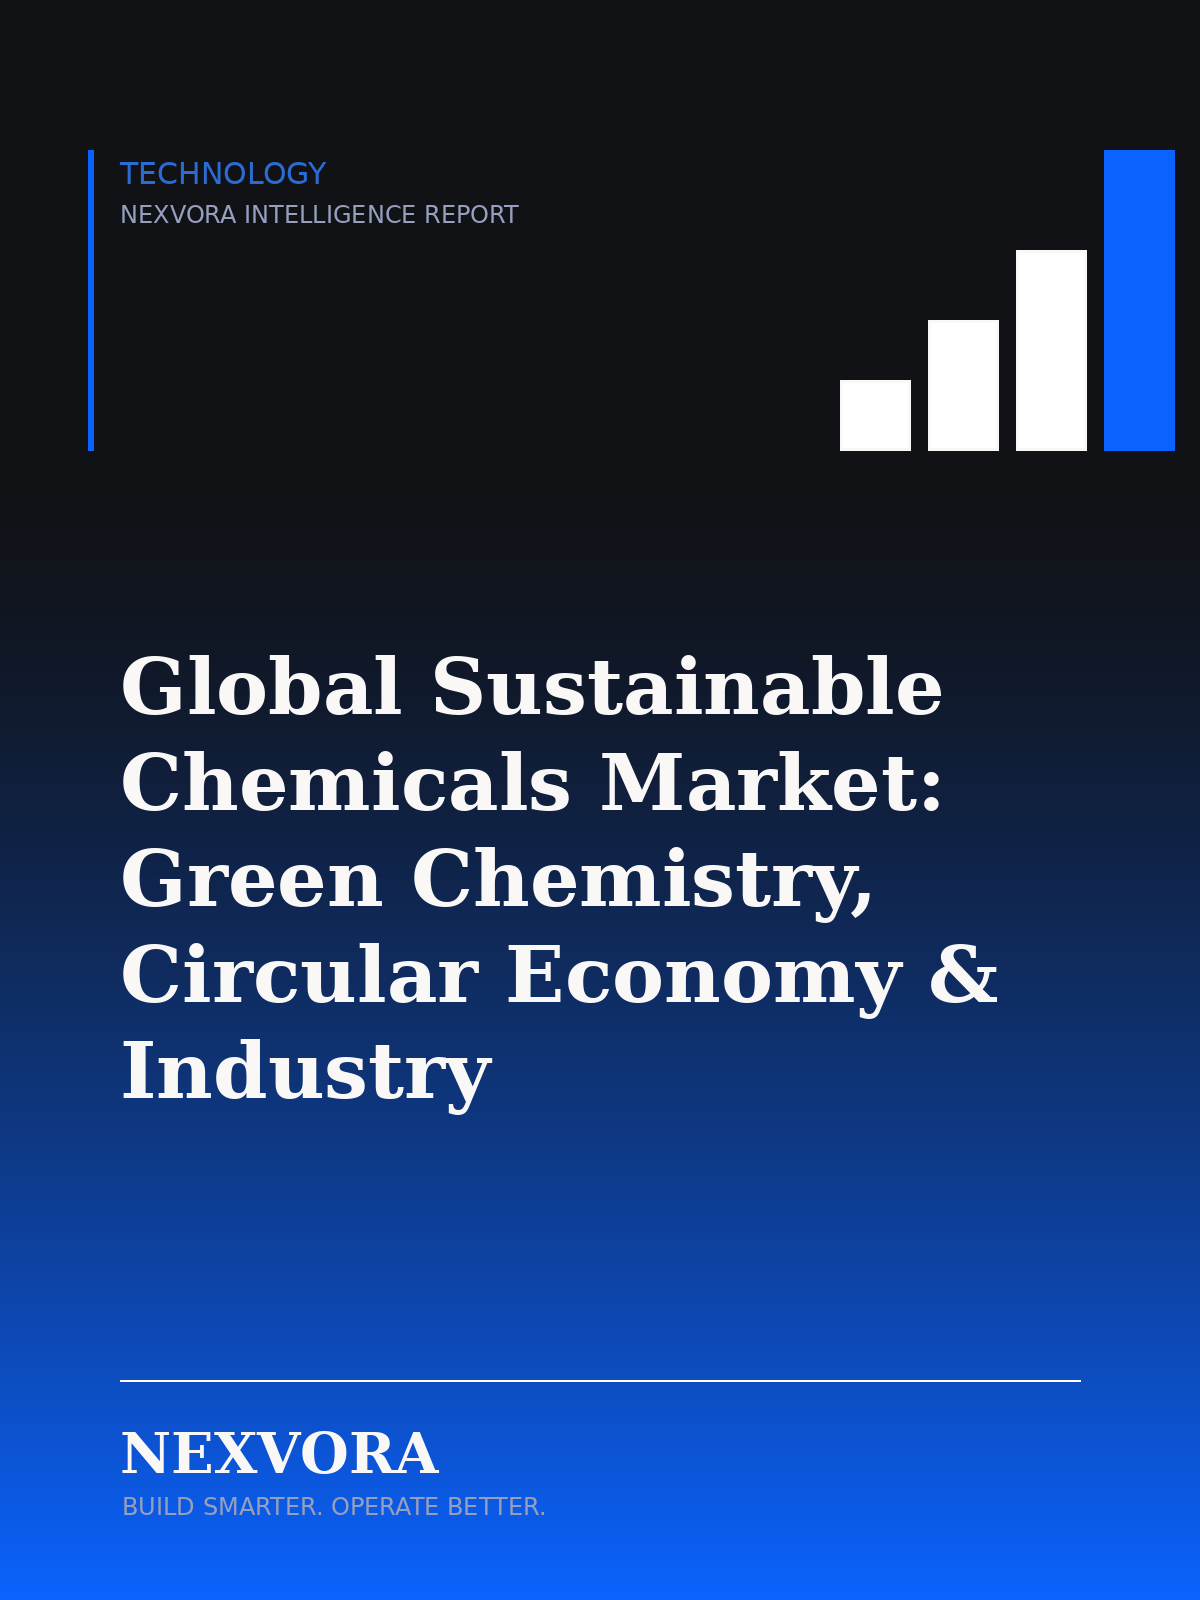
Global Sustainable Chemicals Market — Green Chemistry, Circular Economy & Industry Transformation Intelligence Report
Strategic market outlook and competitive intelligence for sustainable chemical platforms, feedstocks, and applications, 2026–2031
Nexvora Intelligence market report on Global Sustainable Chemicals Market: Green Chemistry, Circular Economy & Industry Transformation, 2026–2031.
per extra user
Instant access after payment. Secure via Razorpay.
The opening view — free.
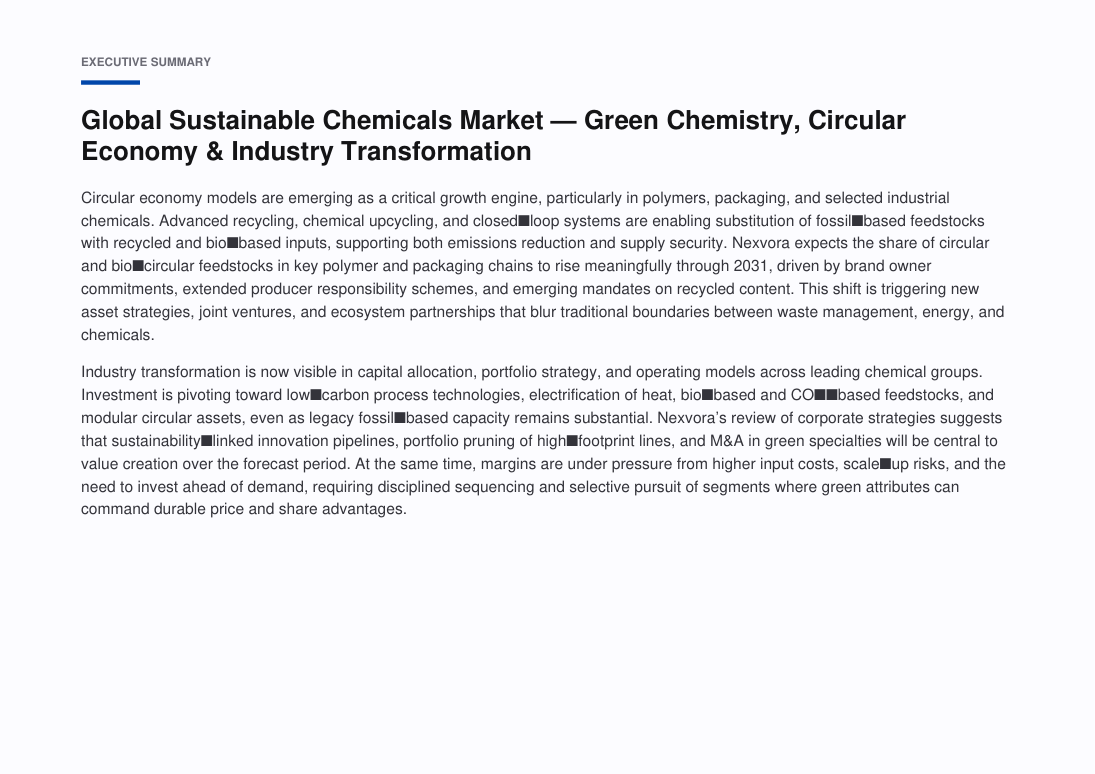
The global sustainable chemicals market is entering a decisive scale-up phase as chemical producers, consumer brands, industrial manufacturers, and policymakers converge around lower-carbon materials, renewable feedstocks, safer formulations, and circular production models. Nexvora Intelligence estimates the addressable market at approximately US$•••–••• billion in 2026, covering bio-based chemicals, recycled-content chemicals, green solvents, biodegradable and compostable polymers, renewable surfactants, low-carbon intermediates, and selected process technologies aligned with green chemistry principles.
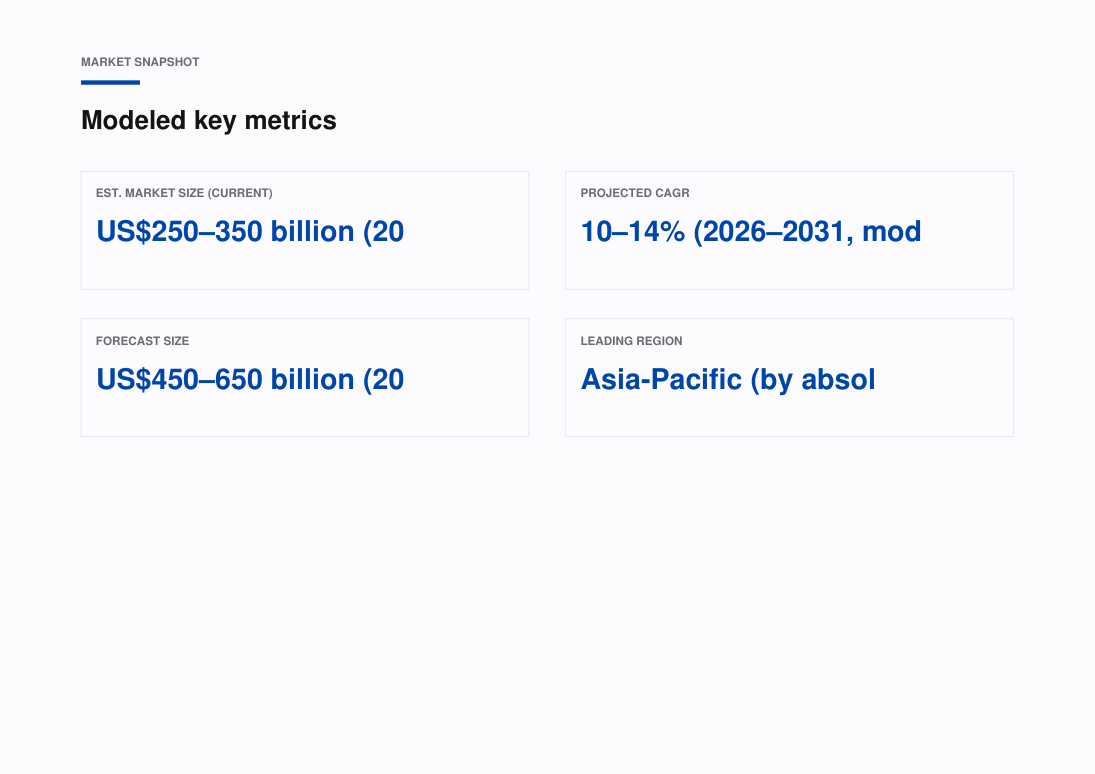
Market growth through 2031 will be driven less by sustainability positioning alone and more by procurement mandates, Scope 3 emissions management, regulatory substitution of hazardous chemistries, packaging circularity targets, and the need for resilient feedstock diversification. Nexvora models a 2026–2031 compound annual growth rate of approximately 10.5–••%, taking the market to an estimated US$•••–••• billion by 2031. Growth will remain uneven, with specialty applications scaling faster than commodity substitutions where price parity and supply reliability remain challenging.
Circular economy models are becoming a core growth vector. Mechanical and chemical recycling, renewable carbon utilization, bio-naphtha integration, mass-balance certification, and waste-derived intermediates are reshaping how producers define sustainable chemistry at commercial scale. While bio-based routes remain strategically important, circular and low-carbon drop-in chemicals are increasingly attractive because they can integrate with existing assets, qualification processes, and downstream customer specifications.
The competitive landscape is shifting from product-level differentiation toward feedstock control, certification credibility, application engineering, and offtake-backed capacity development. Large integrated chemical companies retain advantages in infrastructure and customer access, while specialist innovators are capturing value in fermentation-derived monomers, specialty biosurfactants, green solvents, enzyme-enabled processes, and performance additives. Strategic partnerships between chemical producers, consumer goods companies, waste-management firms, and agriculture-linked feedstock suppliers will be central to de-risking scale-up.
Specific figures are hidden in this free preview. Unlock the report to see all modeled market sizes, forecasts and growth rates.
What this report covers.
Strategic market outlook and competitive intelligence for sustainable chemical platforms, feedstocks, and applications, 2026–2031
Who this report is for.
- Corporate strategy, planning and M&A teams evaluating the market
- Investors, private equity and venture teams sizing the opportunity
- Product, marketing and go-to-market leaders
- Consultants and analysts building the competitive picture
- Executives planning market entry, expansion or investment
How this report is built.
Nexvora Intelligence defines the sustainable chemicals market as chemicals and materials produced through renewable, recycled, low-carbon, safer, or circular pathways where sustainability attributes are commercially material to purchasing decisions.
Market estimates are developed through a proprietary bottom-up model across product families, feedstock pathways, end-use sectors, regional adoption curves, pricing differentials, and capacity ramp assumptions.
Forecasts incorporate expected demand from packaging, personal care, agriculture, automotive, textiles, construction, electronics, and industrial applications, adjusted for substitution feasibility and qualification timelines.
All figures in this opening are Nexvora modeled estimates and should be interpreted as directional market intelligence ranges rather than externally sourced statistics.
What's inside — a number-free look.
A full outline of the figures and tables you'll get. Specific data, market sizes and forecasts are unlocked with purchase.
List of Figures
- Figure 1: Market Overview and Structure — Sustainable Chemicals — Green Chemistry, Circular Economy & Industry Transformation
- Figure 2: Market Size and Forecast Framework — Sustainable Chemicals — Green Chemistry, Circular Economy & Industry Transformation
- Figure 3: Value Chain and Ecosystem Analysis — Sustainable Chemicals — Green Chemistry, Circular Economy & Industry Transformation
- Figure 4: Market Dynamics — Drivers, Restraints and Opportunities — Sustainable Chemicals — Green Chemistry, Circular Economy & Industry Transformation
- Figure 5: Segment Contribution Analysis — Sustainable Chemicals — Green Chemistry, Circular Economy & Industry Transformation
- Figure 6: Regional Market Landscape — Sustainable Chemicals — Green Chemistry, Circular Economy & Industry Transformation
- Figure 7: Country-level Opportunity Mapping — Sustainable Chemicals — Green Chemistry, Circular Economy & Industry Transformation
- Figure 8: Competitive Positioning Matrix — Sustainable Chemicals — Green Chemistry, Circular Economy & Industry Transformation
- Figure 9: Market Share of Leading Players — Sustainable Chemicals — Green Chemistry, Circular Economy & Industry Transformation
- Figure 10: Adoption and Penetration Trends — Sustainable Chemicals — Green Chemistry, Circular Economy & Industry Transformation
- Figure 11: Technology and Innovation Landscape — Sustainable Chemicals — Green Chemistry, Circular Economy & Industry Transformation
- Figure 12: Pricing and Business Model Analysis — Sustainable Chemicals — Green Chemistry, Circular Economy & Industry Transformation
- Figure 13: Investment, Funding and M&A Landscape — Sustainable Chemicals — Green Chemistry, Circular Economy & Industry Transformation
- Figure 14: Regulatory and Policy Framework — Sustainable Chemicals — Green Chemistry, Circular Economy & Industry Transformation
- Figure 15: Porter's Five Forces Analysis — Sustainable Chemicals — Green Chemistry, Circular Economy & Industry Transformation
- Figure 16: PESTLE Analysis — Sustainable Chemicals — Green Chemistry, Circular Economy & Industry Transformation
- Figure 17: Growth Opportunity Heat Map — Sustainable Chemicals — Green Chemistry, Circular Economy & Industry Transformation
- Figure 18: Future Outlook and Strategic Roadmap — Sustainable Chemicals — Green Chemistry, Circular Economy & Industry Transformation
List of Tables
- Table 1: Market Segmentation Overview — Sustainable Chemicals — Green Chemistry, Circular Economy & Industry Transformation
- Table 2: Segment Definitions and Scope — Sustainable Chemicals — Green Chemistry, Circular Economy & Industry Transformation
- Table 3: Regional and Country Coverage Summary — Sustainable Chemicals — Green Chemistry, Circular Economy & Industry Transformation
- Table 4: Key Company Profiles and Offerings — Sustainable Chemicals — Green Chemistry, Circular Economy & Industry Transformation
- Table 5: Competitive Benchmarking Matrix — Sustainable Chemicals — Green Chemistry, Circular Economy & Industry Transformation
- Table 6: Product and Service Portfolio Mapping — Sustainable Chemicals — Green Chemistry, Circular Economy & Industry Transformation
- Table 7: Market Drivers, Restraints and Trends — Sustainable Chemicals — Green Chemistry, Circular Economy & Industry Transformation
- Table 8: Strategic Initiatives and Developments — Sustainable Chemicals — Green Chemistry, Circular Economy & Industry Transformation
- Table 9: Partnerships and Collaborations — Sustainable Chemicals — Green Chemistry, Circular Economy & Industry Transformation
- Table 10: Research Assumptions and Limitations — Sustainable Chemicals — Green Chemistry, Circular Economy & Industry Transformation
- Table 11: Data Sources and References — Sustainable Chemicals — Green Chemistry, Circular Economy & Industry Transformation
- Table 12: Report Scope and Coverage Summary — Sustainable Chemicals — Green Chemistry, Circular Economy & Industry Transformation
A look at the pages.
Landscape report · 20 sections · charts & tables
A genuine peek at the opening pages. Unlock to read every page in full.
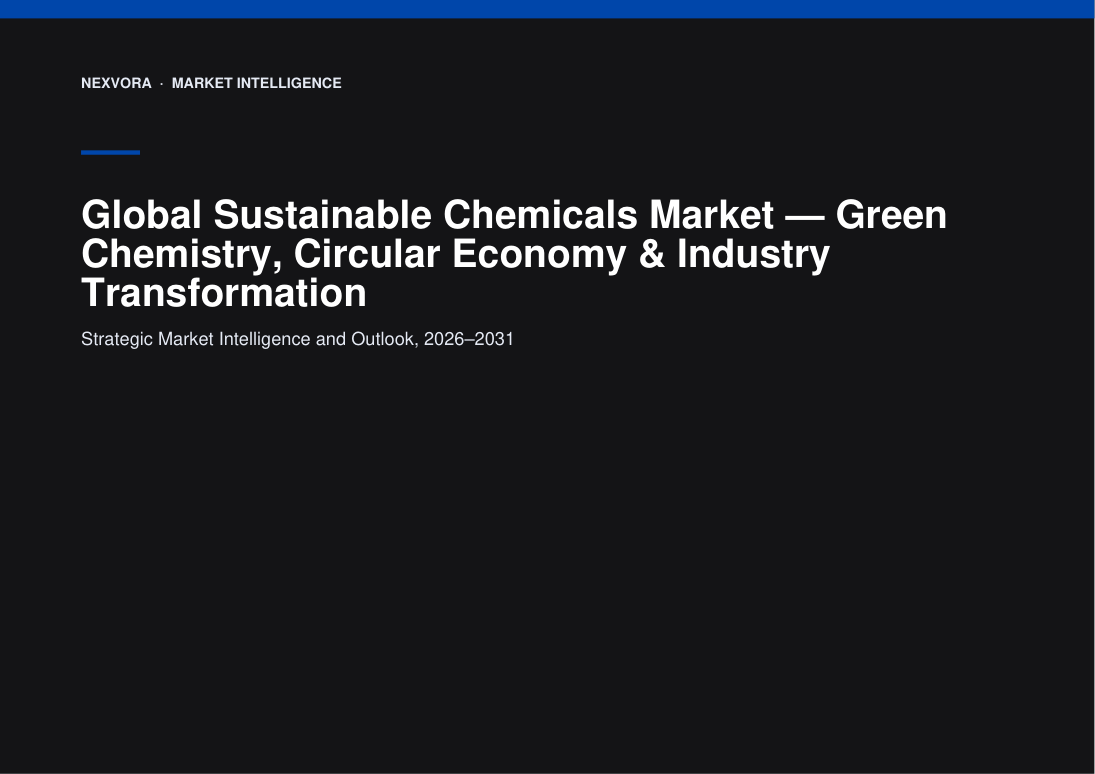
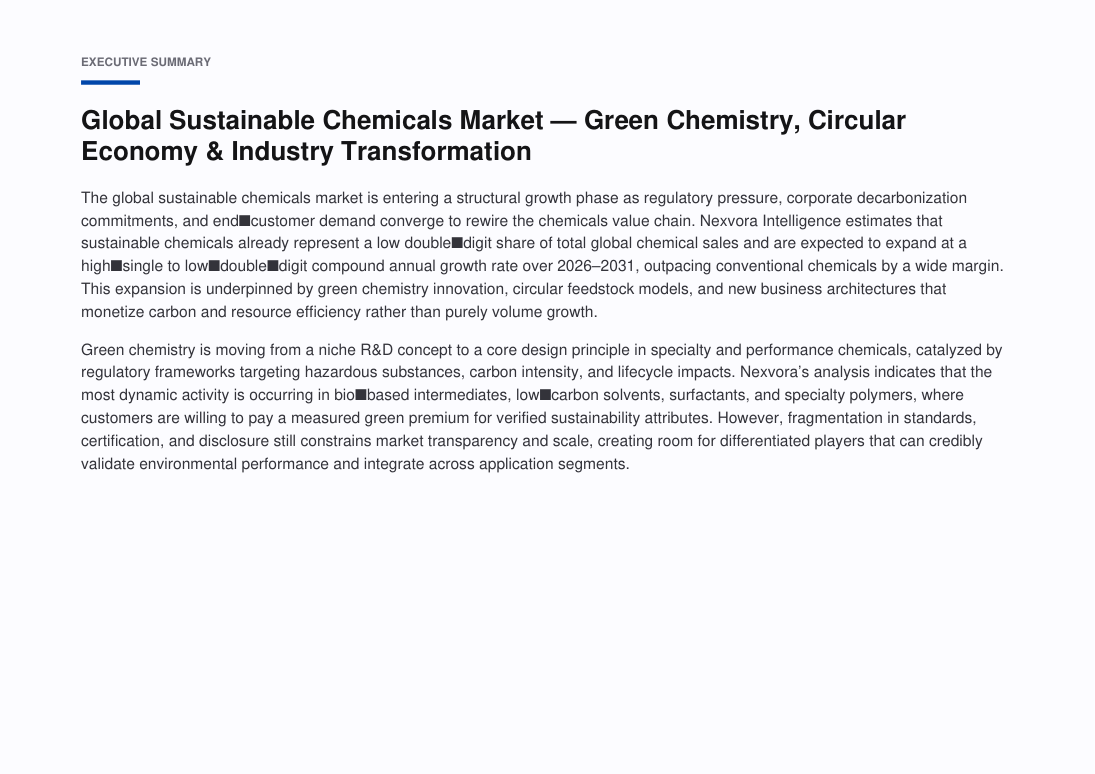
4 of many pages shown
Turn this market into a plan for your business.
Answer a few quick questions and unlock a personalised operational read — your maturity score, prioritised focus areas and quick wins — mapped to where this market is heading. Result delivered instantly and emailed to you.
- Maturity score & prioritised focus areas
- Practical quick wins and a recommended next step
Questions, answered.
How big is the Global Sustainable Chemicals Market?
Nexvora models the Global Sustainable Chemicals Market at approximately US$210–235 billion, 2026E. Full market sizing, segmentation and forecasts are inside the report (modeled estimate).
What is the growth rate (CAGR) of the Global Sustainable Chemicals Market?
The Global Sustainable Chemicals Market is projected to grow at a CAGR of about 10.5–12.0%, 2026–2031E over the forecast period — a Nexvora modeled estimate detailed across the report's 20 sections.
What does this report include?
A complete market intelligence report — market sizing and forecasts, segmentation, regional and industry analysis, competitive landscape, trends, and strategic recommendations across 20 sections.
How do I access it after purchase?
Instantly, in your secure online viewer. Reports are view-only and available on any device from your library.
Are the figures sourced?
Quantitative figures are Nexvora modeled estimates unless explicitly cited to a referenced source within the report.
Can I buy access for my team?
Yes — add user seats at checkout, or subscribe for bulk access across multiple reports.
Nexvora Intelligence research report. All quantitative figures are modeled estimates — not audited data. Not financial or investment advice.
More market reports
Keep exploring intelligence in this and related sectors.
Global Semiconductor Chemicals Market — Electronic Chemicals, Manufacturing Demand & Technology Outlook
Europe Sustainable Materials Market — Circular Materials, Decarbonization & Growth Opportunities

Global Humanoid Robotics Market — Industrial & Service Automation Intelligence Report
