Top Business Research Firms Market Analysis
Evaluate leading business research providers, service models, buyer needs, and competitive positioning.
Compare leading business research firms, market trends, services, pricing models, and buyer criteria to choose the right partner for strategic insight.
per extra user
Instant access after payment. Secure via Razorpay.
The opening view — free.
The global market for technology-focused business research firms is estimated by Nexvora Intelligence at approximately $•••–••• billion in 2025, spanning syndicated research, advisory subscriptions, custom research, vendor benchmarking, market sizing, competitive intelligence, and executive decision-support services. Demand remains structurally resilient because enterprise technology spending decisions are increasingly complex, vendor landscapes are fragmented, and buyers require independent validation across software, cloud, cybersecurity, data infrastructure, automation, and digital transformation programs.
The market is led by a relatively concentrated group of global research and advisory platforms, including firms with strong positions in technology buyer advisory, vendor evaluation, CIO research, industry data, and software market intelligence. At the upper end, scaled providers benefit from recurring subscription models, embedded client relationships, proprietary taxonomies, analyst access, benchmark datasets, and high switching costs. Beneath the leaders, specialist firms compete through vertical depth, regional expertise, pricing flexibility, and custom engagement models.
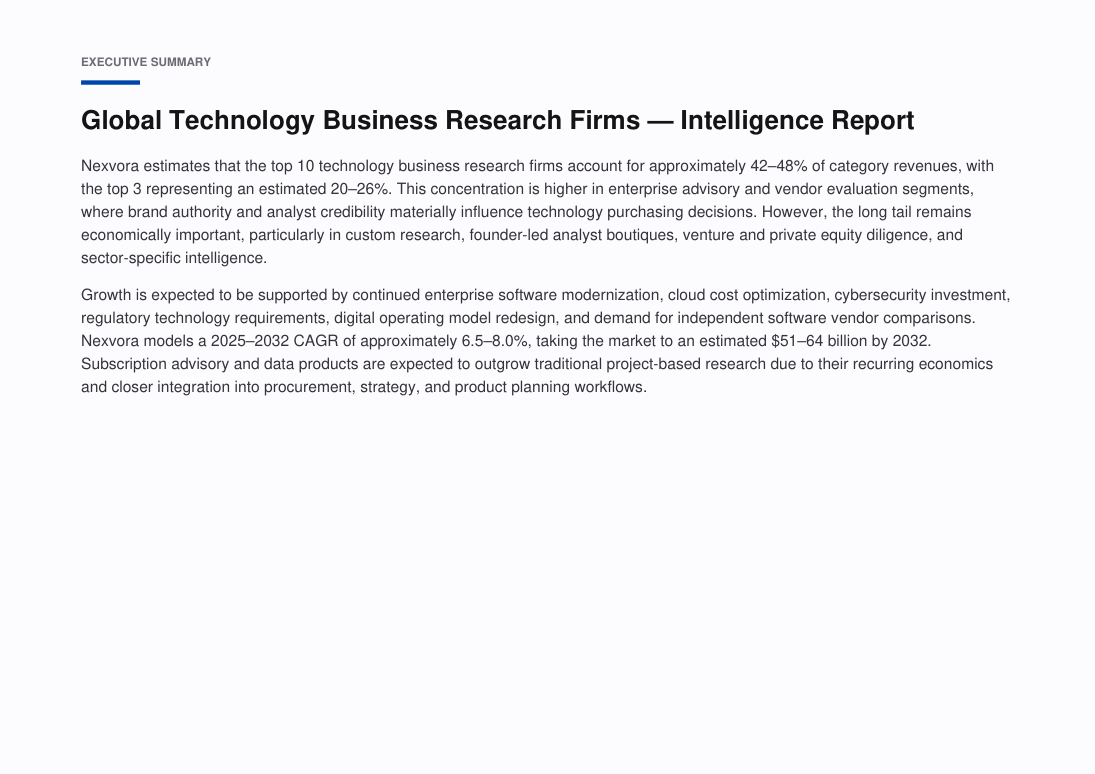
Nexvora estimates that the top 10 technology business research firms account for approximately 42–••% of category revenues, with the top 3 representing an estimated 20–••%. This concentration is higher in enterprise advisory and vendor evaluation segments, where brand authority and analyst credibility materially influence technology purchasing decisions. However, the long tail remains economically important, particularly in custom research, founder-led analyst boutiques, venture and private equity diligence, and sector-specific intelligence.
Growth is expected to be supported by continued enterprise software modernization, cloud cost optimization, cybersecurity investment, regulatory technology requirements, digital operating model redesign, and demand for independent software vendor comparisons. Nexvora models a 2025–2032 CAGR of approximately 6.5–••%, taking the market to an estimated $•••–••• billion by 2032. Subscription advisory and data products are expected to outgrow traditional project-based research due to their recurring economics and closer integration into procurement, strategy, and product planning workflows.
Specific figures are hidden in this free preview. Unlock the report to see all modeled market sizes, forecasts and growth rates.
What this report covers.
Evaluate leading business research providers, service models, buyer needs, and competitive positioning.
Who this report is for.
- Corporate strategy, planning and M&A teams evaluating the market
- Investors, private equity and venture teams sizing the opportunity
- Product, marketing and go-to-market leaders
- Consultants and analysts building the competitive picture
- Executives planning market entry, expansion or investment
How this report is built.
Nexvora Intelligence developed this opening assessment using proprietary market modeling across technology research, advisory, custom intelligence, benchmarking, and software market data segments.
Estimates are derived from triangulation of provider business models, service-line mix, regional demand patterns, client budget behavior, and observed pricing structures across enterprise technology research and advisory markets.
All market figures in this report opening are Nexvora modeled estimates because no external evidence was retrieved for this request.
Modeled ranges are presented to reflect uncertainty in category boundaries, private-company revenue disclosure, bundled advisory contracts, and overlap between technology research, consulting, and data services.
What's inside — a number-free look.
A full outline of the figures and tables you'll get. Specific data, market sizes and forecasts are unlocked with purchase.
List of Figures
- Figure 1: Market Overview and Structure — Top Business Research Firms Analysis
- Figure 2: Market Size and Forecast Framework — Top Business Research Firms Analysis
- Figure 3: Value Chain and Ecosystem Analysis — Top Business Research Firms Analysis
- Figure 4: Market Dynamics — Drivers, Restraints and Opportunities — Top Business Research Firms Analysis
- Figure 5: Segment Contribution Analysis — Top Business Research Firms Analysis
- Figure 6: Regional Market Landscape — Top Business Research Firms Analysis
- Figure 7: Country-level Opportunity Mapping — Top Business Research Firms Analysis
- Figure 8: Competitive Positioning Matrix — Top Business Research Firms Analysis
- Figure 9: Market Share of Leading Players — Top Business Research Firms Analysis
- Figure 10: Adoption and Penetration Trends — Top Business Research Firms Analysis
- Figure 11: Technology and Innovation Landscape — Top Business Research Firms Analysis
- Figure 12: Pricing and Business Model Analysis — Top Business Research Firms Analysis
- Figure 13: Investment, Funding and M&A Landscape — Top Business Research Firms Analysis
- Figure 14: Regulatory and Policy Framework — Top Business Research Firms Analysis
- Figure 15: Porter's Five Forces Analysis — Top Business Research Firms Analysis
- Figure 16: PESTLE Analysis — Top Business Research Firms Analysis
- Figure 17: Growth Opportunity Heat Map — Top Business Research Firms Analysis
- Figure 18: Future Outlook and Strategic Roadmap — Top Business Research Firms Analysis
List of Tables
- Table 1: Market Segmentation Overview — Top Business Research Firms Analysis
- Table 2: Segment Definitions and Scope — Top Business Research Firms Analysis
- Table 3: Regional and Country Coverage Summary — Top Business Research Firms Analysis
- Table 4: Key Company Profiles and Offerings — Top Business Research Firms Analysis
- Table 5: Competitive Benchmarking Matrix — Top Business Research Firms Analysis
- Table 6: Product and Service Portfolio Mapping — Top Business Research Firms Analysis
- Table 7: Market Drivers, Restraints and Trends — Top Business Research Firms Analysis
- Table 8: Strategic Initiatives and Developments — Top Business Research Firms Analysis
- Table 9: Partnerships and Collaborations — Top Business Research Firms Analysis
- Table 10: Research Assumptions and Limitations — Top Business Research Firms Analysis
- Table 11: Data Sources and References — Top Business Research Firms Analysis
- Table 12: Report Scope and Coverage Summary — Top Business Research Firms Analysis
A look at the pages.
Landscape report · 20 sections · charts & tables
A genuine peek at the opening pages. Unlock to read every page in full.
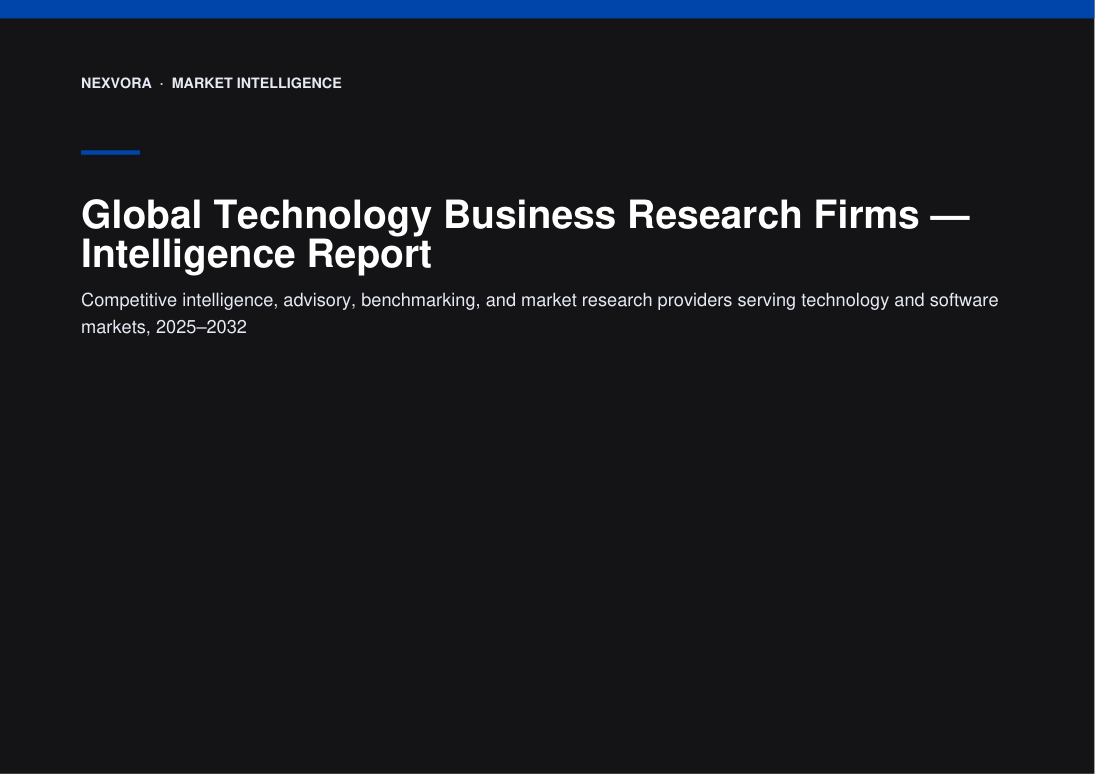
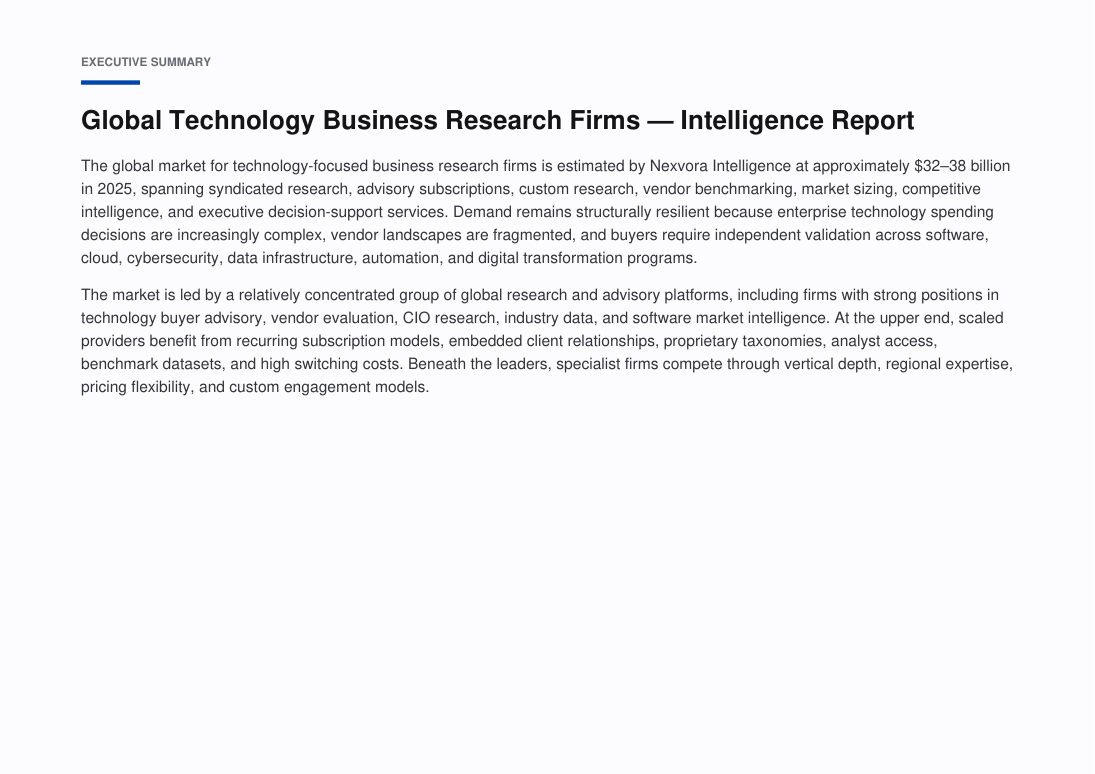
4 of many pages shown
Turn this market into a plan for your business.
Answer a few quick questions and unlock a personalised operational read — your maturity score, prioritised focus areas and quick wins — mapped to where this market is heading. Result delivered instantly and emailed to you.
- Maturity score & prioritised focus areas
- Practical quick wins and a recommended next step
Questions, answered.
How big is the Top Business Research Firms Market Analysis?
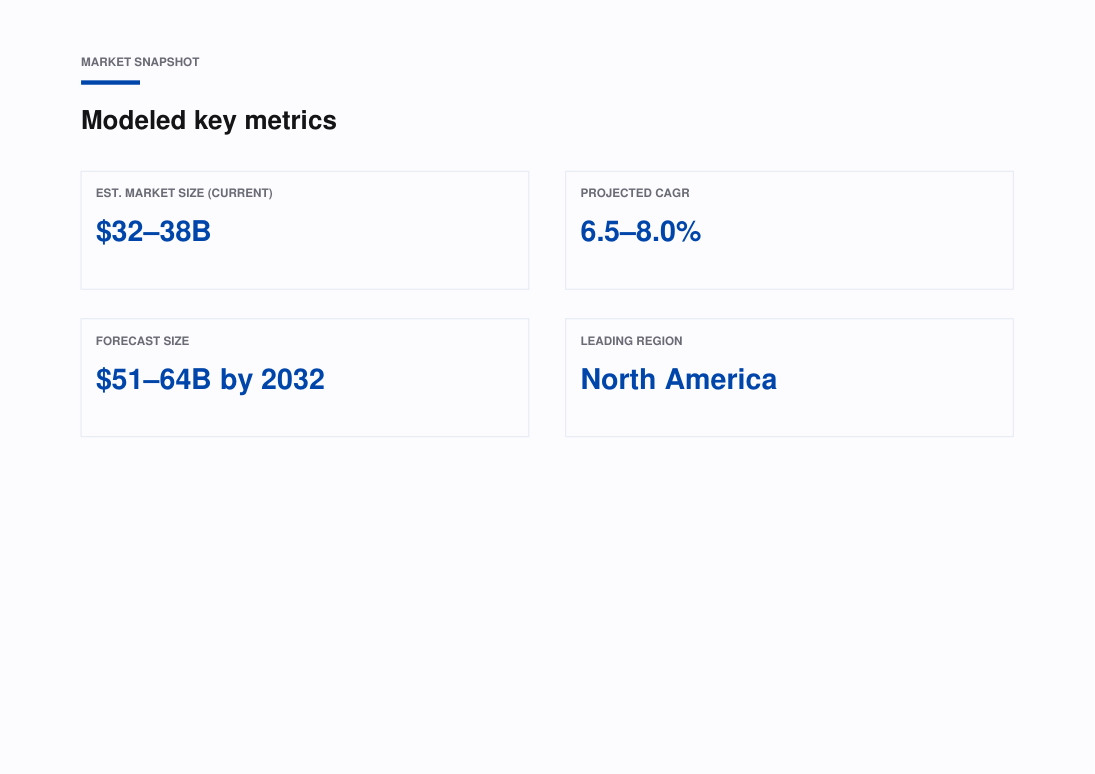
Nexvora models the Top Business Research Firms Market Analysis at approximately $32–38B. Full market sizing, segmentation and forecasts are inside the report (modeled estimate).
What is the growth rate (CAGR) of the Top Business Research Firms Market Analysis?
The Top Business Research Firms Market Analysis is projected to grow at a CAGR of about 6.5–8.0% over the forecast period — a Nexvora modeled estimate detailed across the report's 20 sections.
What does this report include?
A complete market intelligence report — market sizing and forecasts, segmentation, regional and industry analysis, competitive landscape, trends, and strategic recommendations across 20 sections.
How do I access it after purchase?
Instantly, in your secure online viewer. Reports are view-only and available on any device from your library.
Are the figures sourced?
Quantitative figures are Nexvora modeled estimates unless explicitly cited to a referenced source within the report.
Can I buy access for my team?
Yes — add user seats at checkout, or subscribe for bulk access across multiple reports.
Nexvora Intelligence research report. All quantitative figures are modeled estimates — not audited data. Not financial or investment advice.
More market reports
Keep exploring intelligence in this and related sectors.

Global Agentic Enterprise Software Market — Intelligence Report
Nexvora vs. McKinsey: Technology & Software Advisory Market — Competitive Intelligence Report

Global Intelligent PCs, On-Device Generative Computing and NPU Software Ecosystem — Intelligence Report