
Global Quick Commerce & Last-Mile Delivery Market — Intelligence Report
Consumer delivery networks, ultra-fast fulfillment, and urban logistics economics, 2025–2032
Dark-store economics, delivery density and the path to unit-level profitability.

per extra user
Instant access after payment. Secure via Razorpay.
The opening view — free.
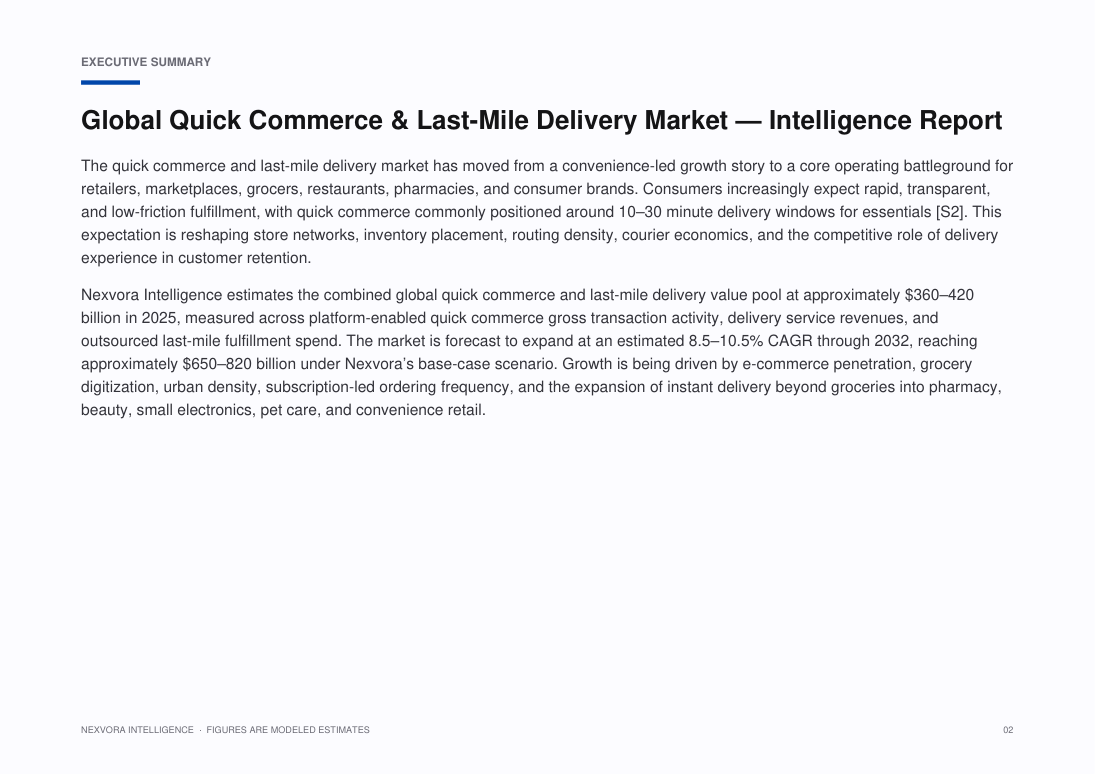
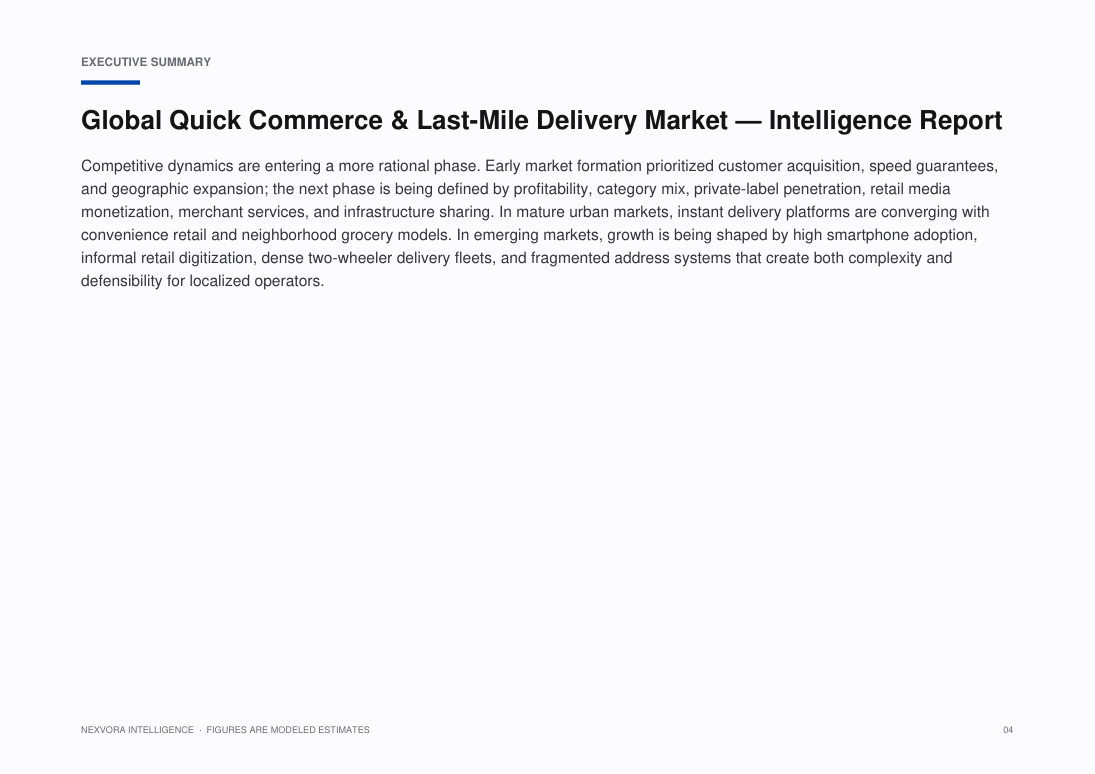
The quick commerce and last-mile delivery market has moved from a convenience-led growth story to a core operating battleground for retailers, marketplaces, grocers, restaurants, pharmacies, and consumer brands. Consumers increasingly expect rapid, transparent, and low-friction fulfillment, with quick commerce commonly positioned around 10–30 minute delivery windows for essentials [S2]. This expectation is reshaping store networks, inventory placement, routing density, courier economics, and the competitive role of delivery experience in customer retention.
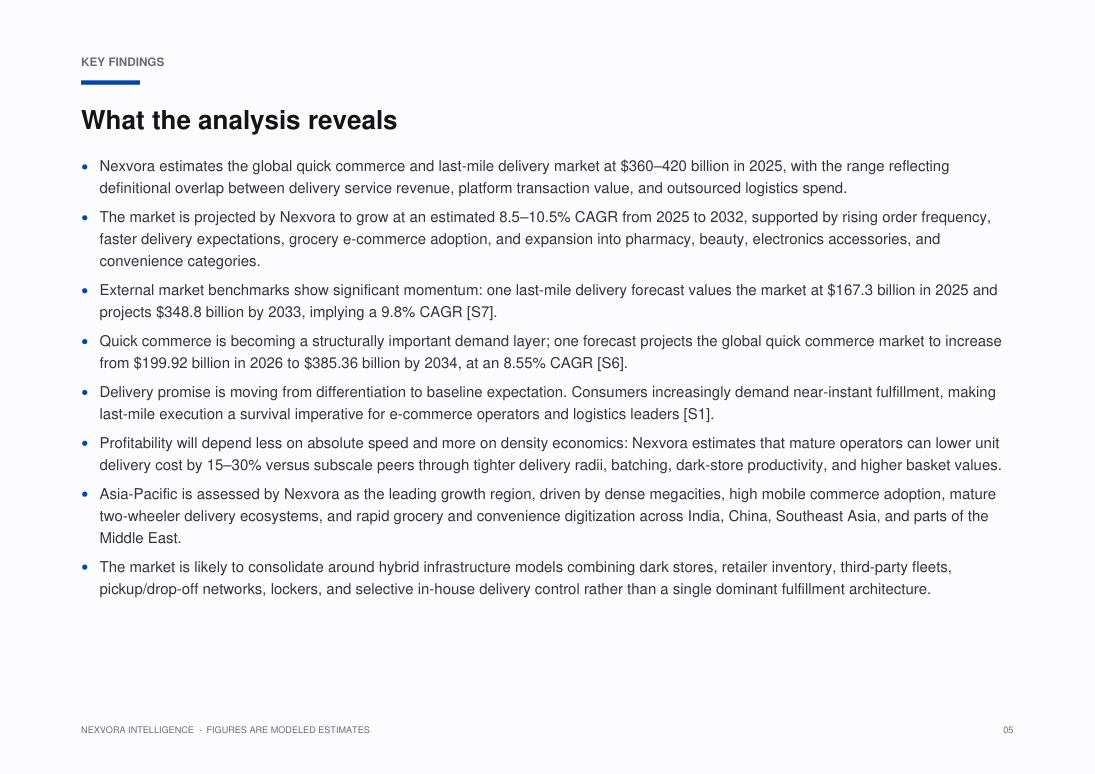
Nexvora Intelligence estimates the combined global quick commerce and last-mile delivery value pool at approximately $•••–••• billion in 2025, measured across platform-enabled quick commerce gross transaction activity, delivery service revenues, and outsourced last-mile fulfillment spend. The market is forecast to expand at an estimated 8.5–••% CAGR through 2032, reaching approximately $•••–••• billion under Nexvora’s base-case scenario. Growth is being driven by e-commerce penetration, grocery digitization, urban density, subscription-led ordering frequency, and the expansion of instant delivery beyond groceries into pharmacy, beauty, small electronics, pet care, and convenience retail.
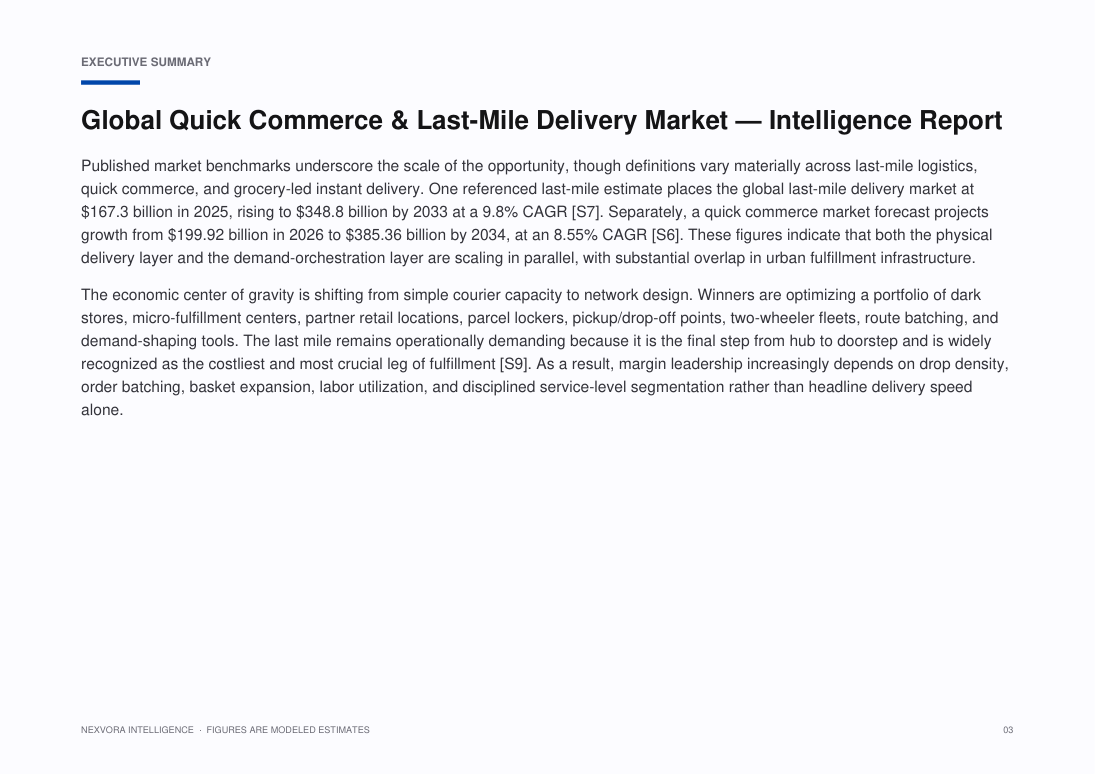
Published market benchmarks underscore the scale of the opportunity, though definitions vary materially across last-mile logistics, quick commerce, and grocery-led instant delivery. One referenced last-mile estimate places the global last-mile delivery market at $••• in 2025, rising to $••• by 2033 at a ••% CAGR [S7]. Separately, a quick commerce market forecast projects growth from $••• in 2026 to $••• by 2034, at an ••% CAGR [S6]. These figures indicate that both the physical delivery layer and the demand-orchestration layer are scaling in parallel, with substantial overlap in urban fulfillment infrastructure.
The economic center of gravity is shifting from simple courier capacity to network design. Winners are optimizing a portfolio of dark stores, micro-fulfillment centers, partner retail locations, parcel lockers, pickup/drop-off points, two-wheeler fleets, route batching, and demand-shaping tools. The last mile remains operationally demanding because it is the final step from hub to doorstep and is widely recognized as the costliest and most crucial leg of fulfillment [S9]. As a result, margin leadership increasingly depends on drop density, order batching, basket expansion, labor utilization, and disciplined service-level segmentation rather than headline delivery speed alone.
Specific figures are hidden in this free preview. Unlock the report to see all modeled market sizes, forecasts and growth rates.
What this report covers.
Consumer delivery networks, ultra-fast fulfillment, and urban logistics economics, 2025–2032
Who this report is for.
- Corporate strategy, planning and M&A teams evaluating the market
- Investors, private equity and venture teams sizing the opportunity
- Product, marketing and go-to-market leaders
- Consultants and analysts building the competitive picture
- Executives planning market entry, expansion or investment
How this report is built.
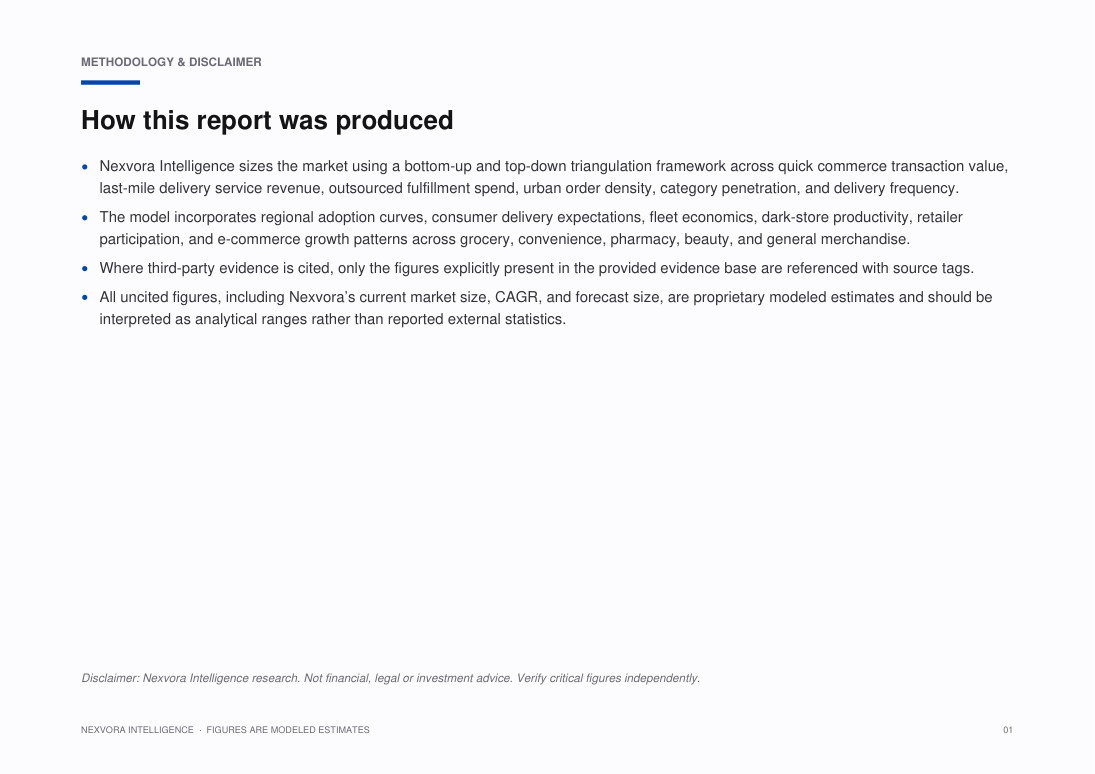
Nexvora Intelligence sizes the market using a bottom-up and top-down triangulation framework across quick commerce transaction value, last-mile delivery service revenue, outsourced fulfillment spend, urban order density, category penetration, and delivery frequency.
The model incorporates regional adoption curves, consumer delivery expectations, fleet economics, dark-store productivity, retailer participation, and e-commerce growth patterns across grocery, convenience, pharmacy, beauty, and general merchandise.
Where third-party evidence is cited, only the figures explicitly present in the provided evidence base are referenced with source tags.
All uncited figures, including Nexvora’s current market size, CAGR, and forecast size, are proprietary modeled estimates and should be interpreted as analytical ranges rather than reported external statistics.
What's inside — a number-free look.
A full outline of the figures and tables you'll get. Specific data, market sizes and forecasts are unlocked with purchase.
List of Figures
- Figure 1: Market Overview and Structure — Quick Commerce & Last-Mile Delivery
- Figure 2: Market Size and Forecast Framework — Quick Commerce & Last-Mile Delivery
- Figure 3: Value Chain and Ecosystem Analysis — Quick Commerce & Last-Mile Delivery
- Figure 4: Market Dynamics — Drivers, Restraints and Opportunities — Quick Commerce & Last-Mile Delivery
- Figure 5: Segment Contribution Analysis — Quick Commerce & Last-Mile Delivery
- Figure 6: Regional Market Landscape — Quick Commerce & Last-Mile Delivery
- Figure 7: Country-level Opportunity Mapping — Quick Commerce & Last-Mile Delivery
- Figure 8: Competitive Positioning Matrix — Quick Commerce & Last-Mile Delivery
- Figure 9: Market Share of Leading Players — Quick Commerce & Last-Mile Delivery
- Figure 10: Adoption and Penetration Trends — Quick Commerce & Last-Mile Delivery
- Figure 11: Technology and Innovation Landscape — Quick Commerce & Last-Mile Delivery
- Figure 12: Pricing and Business Model Analysis — Quick Commerce & Last-Mile Delivery
- Figure 13: Investment, Funding and M&A Landscape — Quick Commerce & Last-Mile Delivery
- Figure 14: Regulatory and Policy Framework — Quick Commerce & Last-Mile Delivery
- Figure 15: Porter's Five Forces Analysis — Quick Commerce & Last-Mile Delivery
- Figure 16: PESTLE Analysis — Quick Commerce & Last-Mile Delivery
- Figure 17: Growth Opportunity Heat Map — Quick Commerce & Last-Mile Delivery
- Figure 18: Future Outlook and Strategic Roadmap — Quick Commerce & Last-Mile Delivery
List of Tables
- Table 1: Market Segmentation Overview — Quick Commerce & Last-Mile Delivery
- Table 2: Segment Definitions and Scope — Quick Commerce & Last-Mile Delivery
- Table 3: Regional and Country Coverage Summary — Quick Commerce & Last-Mile Delivery
- Table 4: Key Company Profiles and Offerings — Quick Commerce & Last-Mile Delivery
- Table 5: Competitive Benchmarking Matrix — Quick Commerce & Last-Mile Delivery
- Table 6: Product and Service Portfolio Mapping — Quick Commerce & Last-Mile Delivery
- Table 7: Market Drivers, Restraints and Trends — Quick Commerce & Last-Mile Delivery
- Table 8: Strategic Initiatives and Developments — Quick Commerce & Last-Mile Delivery
- Table 9: Partnerships and Collaborations — Quick Commerce & Last-Mile Delivery
- Table 10: Research Assumptions and Limitations — Quick Commerce & Last-Mile Delivery
- Table 11: Data Sources and References — Quick Commerce & Last-Mile Delivery
- Table 12: Report Scope and Coverage Summary — Quick Commerce & Last-Mile Delivery
A look at the pages.
88 pages · 20 sections · charts & tables
A genuine peek at the opening pages. Unlock to read every page in full.
6 of 88 pages shown
Turn this market into a plan for your business.
Answer a few quick questions and unlock a personalised operational read — your maturity score, prioritised focus areas and quick wins — mapped to where this market is heading. Result delivered instantly and emailed to you.
- Maturity score & prioritised focus areas
- Practical quick wins and a recommended next step
Questions, answered.
How big is the Global Quick Commerce & Last-Mile Delivery Market?
Nexvora models the Global Quick Commerce & Last-Mile Delivery Market at approximately $360–420 billion, 2025E. Full market sizing, segmentation and forecasts are inside the report (modeled estimate).
What is the growth rate (CAGR) of the Global Quick Commerce & Last-Mile Delivery Market?
The Global Quick Commerce & Last-Mile Delivery Market is projected to grow at a CAGR of about 8.5–10.5%, 2025–2032E over the forecast period — a Nexvora modeled estimate detailed across the report's 20 sections.
What does this report include?
A complete market intelligence report — market sizing and forecasts, segmentation, regional and industry analysis, competitive landscape, trends, and strategic recommendations across 20 sections.
How do I access it after purchase?
Instantly, in your secure online viewer. Reports are view-only and available on any device from your library.
Are the figures sourced?
Quantitative figures are Nexvora modeled estimates unless explicitly cited to a referenced source within the report.
Can I buy access for my team?
Yes — add user seats at checkout, or subscribe for bulk access across multiple reports.
Nexvora Intelligence research report. All quantitative figures are modeled estimates — not audited data. Not financial or investment advice.
More market reports
Keep exploring intelligence in this and related sectors.
Global Retail Media Networks, Shoppable CTV and Commerce Data Clean Rooms Market — Intelligence Report

Global Agentic Commerce, Shopping Assistants and Merchant Orchestration Platforms Market — Intelligence Report
Global Retail Media Networks and Commerce Advertising Platforms Market — Intelligence Report