
India E-Commerce Logistics Market Report 2026–2030
Nexvora Intelligence — Market Report
Nexvora Intelligence market report on India E-Commerce Logistics Market Report 2026–2030.
per extra user
Instant access after payment. Secure via Razorpay.
The opening view — free.
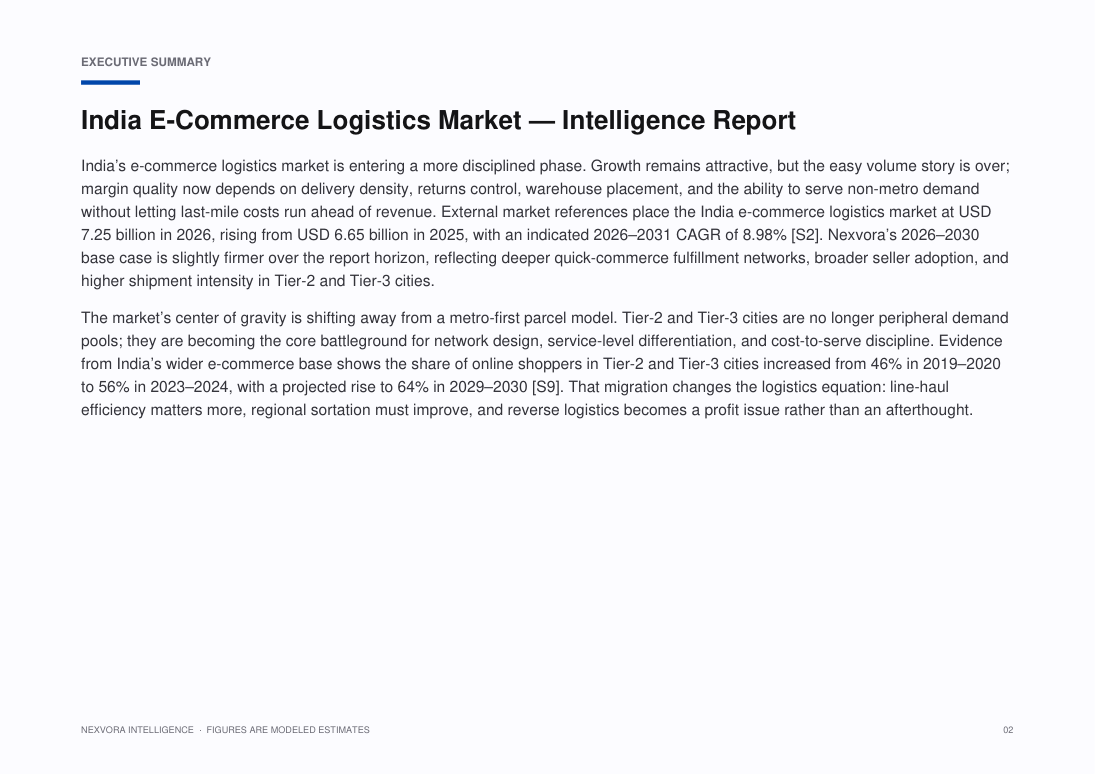
India’s e-commerce logistics market is entering a more disciplined phase. Growth remains attractive, but the easy volume story is over; margin quality now depends on delivery density, returns control, warehouse placement, and the ability to serve non-metro demand without letting last-mile costs run ahead of revenue. External market references place the India e-commerce logistics market at USD ••• billion in 2026, rising from USD ••• billion in 2025, with an indicated 2026–2031 CAGR of ••% [S2]. Nexvora’s 2026–2030 base case is slightly firmer over the report horizon, reflecting deeper quick-commerce fulfillment networks, broader seller adoption, and higher shipment intensity in Tier-2 and Tier-3 cities.
The market’s center of gravity is shifting away from a metro-first parcel model. Tier-2 and Tier-3 cities are no longer peripheral demand pools; they are becoming the core battleground for network design, service-level differentiation, and cost-to-serve discipline. Evidence from India’s wider e-commerce base shows the share of online shoppers in Tier-2 and Tier-3 cities increased from ••% in 2019–2020 to ••% in 2023–2024, with a projected rise to ••% in 2029–2030 [S9]. That migration changes the logistics equation: line-haul efficiency matters more, regional sortation must improve, and reverse logistics becomes a profit issue rather than an afterthought.
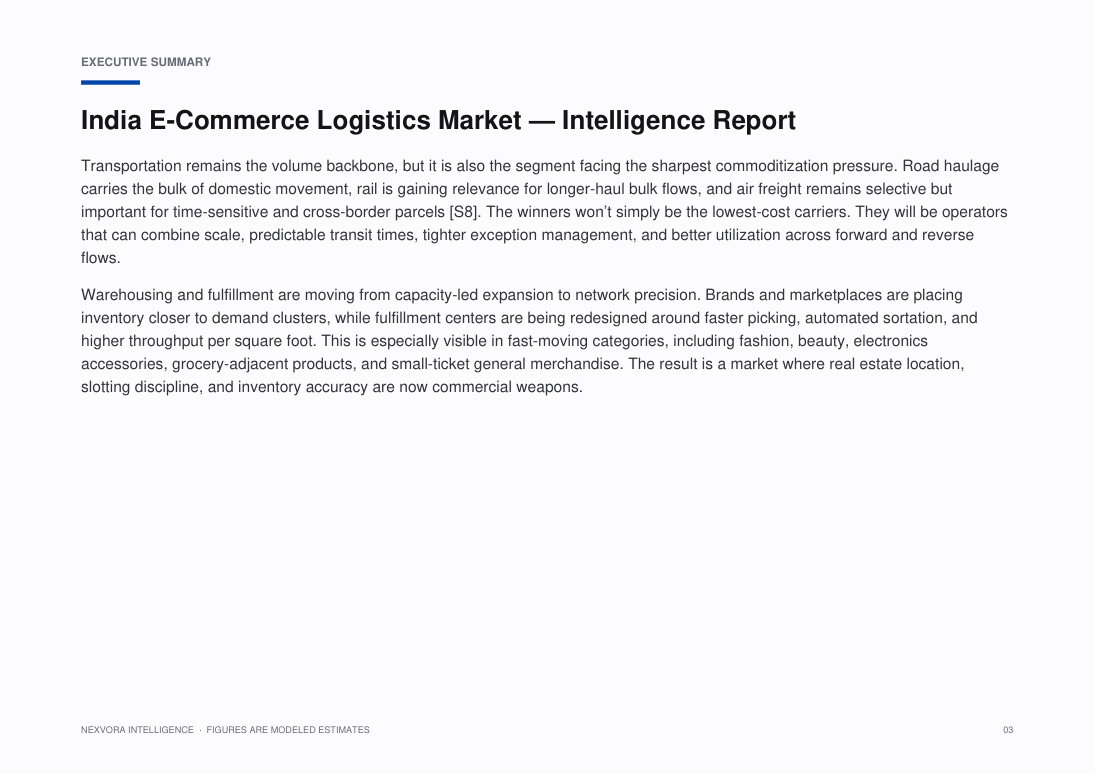
Transportation remains the volume backbone, but it is also the segment facing the sharpest commoditization pressure. Road haulage carries the bulk of domestic movement, rail is gaining relevance for longer-haul bulk flows, and air freight remains selective but important for time-sensitive and cross-border parcels [S8]. The winners won’t simply be the lowest-cost carriers. They will be operators that can combine scale, predictable transit times, tighter exception management, and better utilization across forward and reverse flows.
Warehousing and fulfillment are moving from capacity-led expansion to network precision. Brands and marketplaces are placing inventory closer to demand clusters, while fulfillment centers are being redesigned around faster picking, automated sortation, and higher throughput per square foot. This is especially visible in fast-moving categories, including fashion, beauty, electronics accessories, grocery-adjacent products, and small-ticket general merchandise. The result is a market where real estate location, slotting discipline, and inventory accuracy are now commercial weapons.
Specific figures are hidden in this free preview. Unlock the report to see all modeled market sizes, forecasts and growth rates.
What this report covers.
Nexvora Intelligence — Market Report
Who this report is for.
- Corporate strategy, planning and M&A teams evaluating the market
- Investors, private equity and venture teams sizing the opportunity
- Product, marketing and go-to-market leaders
- Consultants and analysts building the competitive picture
- Executives planning market entry, expansion or investment
How this report is built.
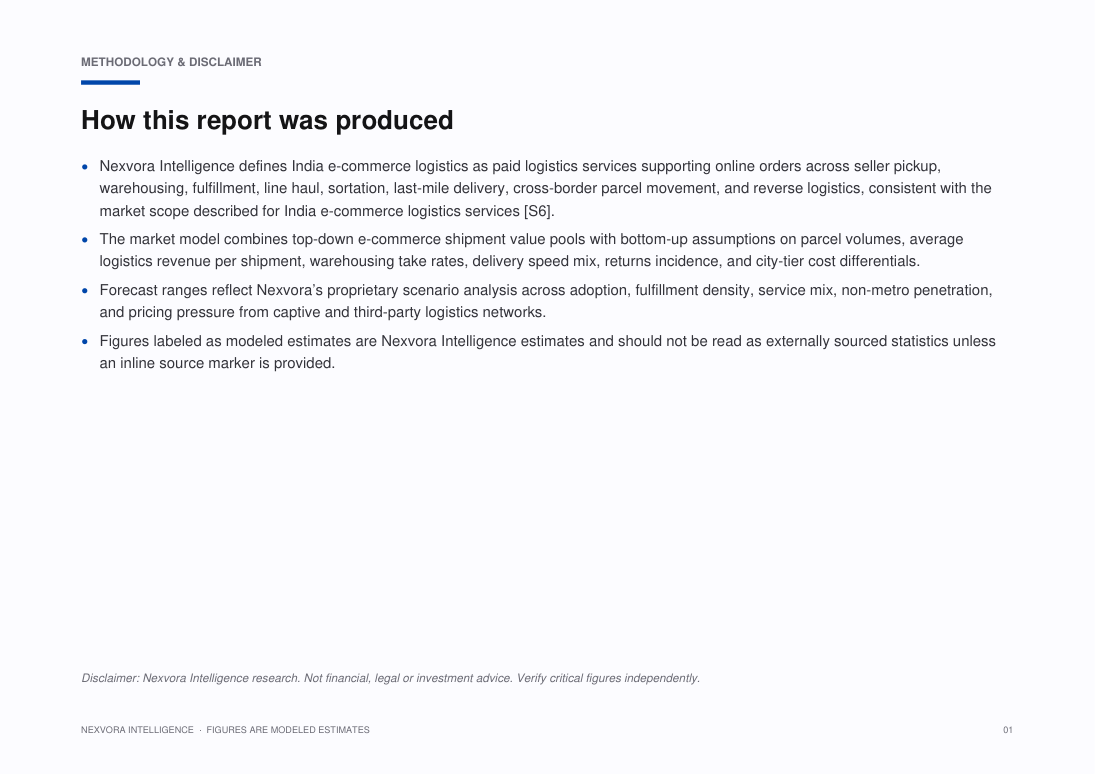
Nexvora Intelligence defines India e-commerce logistics as paid logistics services supporting online orders across seller pickup, warehousing, fulfillment, line haul, sortation, last-mile delivery, cross-border parcel movement, and reverse logistics, consistent with the market scope described for India e-commerce logistics services [S6].
The market model combines top-down e-commerce shipment value pools with bottom-up assumptions on parcel volumes, average logistics revenue per shipment, warehousing take rates, delivery speed mix, returns incidence, and city-tier cost differentials.
Forecast ranges reflect Nexvora’s proprietary scenario analysis across adoption, fulfillment density, service mix, non-metro penetration, and pricing pressure from captive and third-party logistics networks.
Figures labeled as modeled estimates are Nexvora Intelligence estimates and should not be read as externally sourced statistics unless an inline source marker is provided.
What's inside — a number-free look.
A full outline of the figures and tables you'll get. Specific data, market sizes and forecasts are unlocked with purchase.
List of Figures
- Figure 1: Market Overview and Structure — India E-Commerce Logistics 2026–2030
- Figure 2: Market Size and Forecast Framework — India E-Commerce Logistics 2026–2030
- Figure 3: Value Chain and Ecosystem Analysis — India E-Commerce Logistics 2026–2030
- Figure 4: Market Dynamics — Drivers, Restraints and Opportunities — India E-Commerce Logistics 2026–2030
- Figure 5: Segment Contribution Analysis — India E-Commerce Logistics 2026–2030
- Figure 6: Regional Market Landscape — India E-Commerce Logistics 2026–2030
- Figure 7: Country-level Opportunity Mapping — India E-Commerce Logistics 2026–2030
- Figure 8: Competitive Positioning Matrix — India E-Commerce Logistics 2026–2030
- Figure 9: Market Share of Leading Players — India E-Commerce Logistics 2026–2030
- Figure 10: Adoption and Penetration Trends — India E-Commerce Logistics 2026–2030
- Figure 11: Technology and Innovation Landscape — India E-Commerce Logistics 2026–2030
- Figure 12: Pricing and Business Model Analysis — India E-Commerce Logistics 2026–2030
- Figure 13: Investment, Funding and M&A Landscape — India E-Commerce Logistics 2026–2030
- Figure 14: Regulatory and Policy Framework — India E-Commerce Logistics 2026–2030
- Figure 15: Porter's Five Forces Analysis — India E-Commerce Logistics 2026–2030
- Figure 16: PESTLE Analysis — India E-Commerce Logistics 2026–2030
- Figure 17: Growth Opportunity Heat Map — India E-Commerce Logistics 2026–2030
- Figure 18: Future Outlook and Strategic Roadmap — India E-Commerce Logistics 2026–2030
List of Tables
- Table 1: Market Segmentation Overview — India E-Commerce Logistics 2026–2030
- Table 2: Segment Definitions and Scope — India E-Commerce Logistics 2026–2030
- Table 3: Regional and Country Coverage Summary — India E-Commerce Logistics 2026–2030
- Table 4: Key Company Profiles and Offerings — India E-Commerce Logistics 2026–2030
- Table 5: Competitive Benchmarking Matrix — India E-Commerce Logistics 2026–2030
- Table 6: Product and Service Portfolio Mapping — India E-Commerce Logistics 2026–2030
- Table 7: Market Drivers, Restraints and Trends — India E-Commerce Logistics 2026–2030
- Table 8: Strategic Initiatives and Developments — India E-Commerce Logistics 2026–2030
- Table 9: Partnerships and Collaborations — India E-Commerce Logistics 2026–2030
- Table 10: Research Assumptions and Limitations — India E-Commerce Logistics 2026–2030
- Table 11: Data Sources and References — India E-Commerce Logistics 2026–2030
- Table 12: Report Scope and Coverage Summary — India E-Commerce Logistics 2026–2030
A look at the pages.
Landscape report · 20 sections · charts & tables
A genuine peek at the opening pages. Unlock to read every page in full.
4 of many pages shown
Turn this market into a plan for your business.
Answer a few quick questions and unlock a personalised operational read — your maturity score, prioritised focus areas and quick wins — mapped to where this market is heading. Result delivered instantly and emailed to you.
- Maturity score & prioritised focus areas
- Practical quick wins and a recommended next step
Questions, answered.
How big is the India E-Commerce Logistics Market Report 2026–2030?
Nexvora models the India E-Commerce Logistics Market Report 2026–2030 at approximately USD 7.2–7.5 billion. Full market sizing, segmentation and forecasts are inside the report (modeled estimate).
What is the growth rate (CAGR) of the India E-Commerce Logistics Market Report 2026–2030?
The India E-Commerce Logistics Market Report 2026–2030 is projected to grow at a CAGR of about 9.5–10.8% over the forecast period — a Nexvora modeled estimate detailed across the report's 20 sections.
What does this report include?
A complete market intelligence report — market sizing and forecasts, segmentation, regional and industry analysis, competitive landscape, trends, and strategic recommendations across 20 sections.
How do I access it after purchase?
Instantly, in your secure online viewer. Reports are view-only and available on any device from your library.
Are the figures sourced?
Quantitative figures are Nexvora modeled estimates unless explicitly cited to a referenced source within the report.
Can I buy access for my team?
Yes — add user seats at checkout, or subscribe for bulk access across multiple reports.
Nexvora Intelligence research report. All quantitative figures are modeled estimates — not audited data. Not financial or investment advice.
Last-Mile Delivery Technology vs Cold Chain Logistics Solutions
Choose DHL’s Cold Chain Logistics Solutions if you need logistics and warehousing with a clear focus on cold chain operations and temperature-controlled storage. Choose FedEx’s Last-Mile Delivery Technology if your priority is last-mile delivery capabilities within logistics and warehousing, and you are less concerned with explicitly defined cold chain functionality. Since solution type and pricing are not fully disclosed for FedEx, and release years and pricing are undisclosed for both, the right choice ultimately depends on whether your core requirement is temperature-controlled logistics or last-mile delivery technology.
Grounded in published specifications — guidance, not an endorsement.
More market reports
Keep exploring intelligence in this and related sectors.
Australia Logistics & Warehousing Market — E-Commerce, Cold Chain, Distribution & Supply Chain Infrastructure
Japan Logistics & Warehousing Market — Automation, Robotics, E-Commerce & Last-Mile Delivery Outlook

France Logistics & Warehousing Market — Intelligence Report

China Logistics & Warehousing Market — Manufacturing, E-Commerce, Smart Warehousing & Supply Chain Transformation
AI Analyst
Insights and answers generated live from India E-Commerce Logistics Market Report 2026–2030's verified data. Modeled estimates — not investment advice.
Not enough data yet to generate insights.