
Global Virtual Power Plants & Distributed Energy Resource Management Systems Market — Intelligence Report
Proprietary market outlook for grid orchestration platforms, VPP aggregation, and DERMS deployments, 2025–2032
Nexvora Intelligence market report on Global Virtual Power Plants & Distributed Energy Resource Management Systems Market.

per extra user
Instant access after payment. Secure via Razorpay.
The opening view — free.
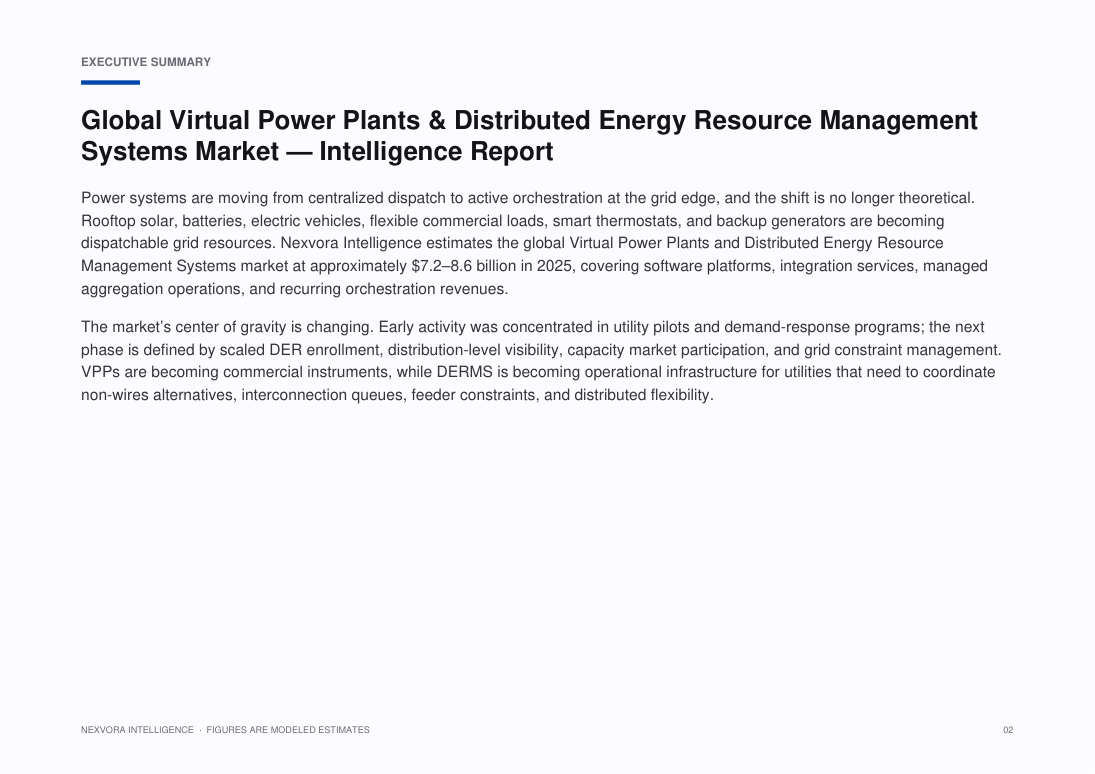
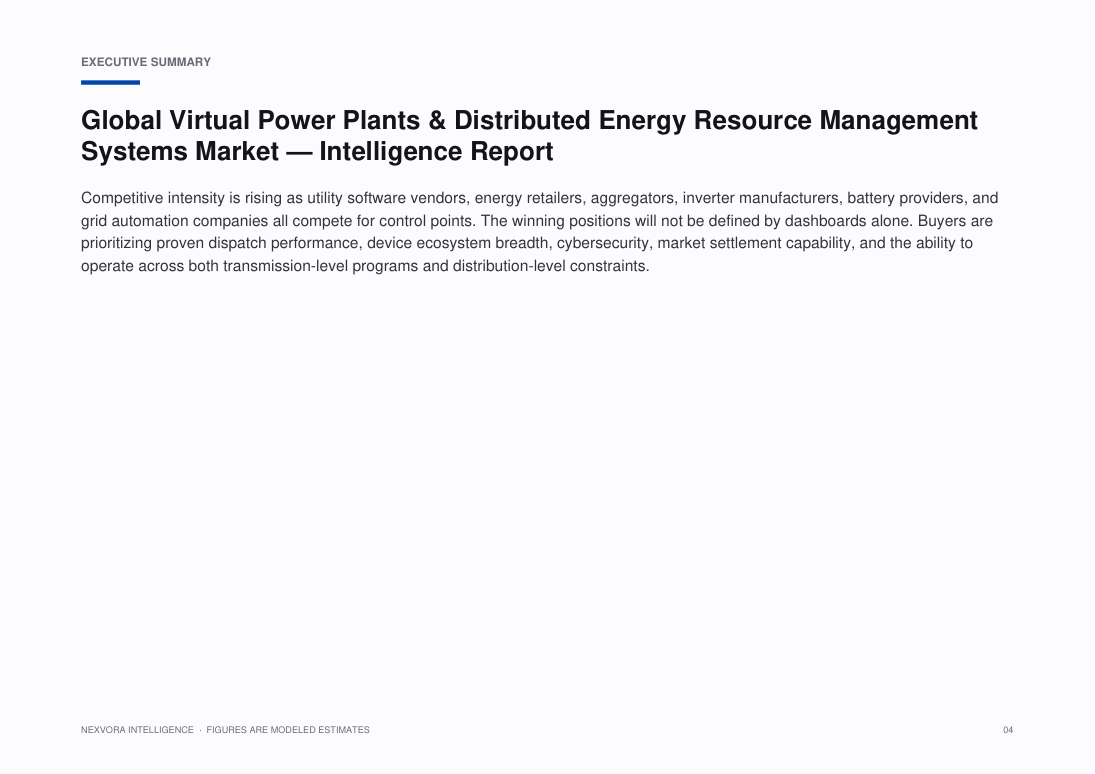
Power systems are moving from centralized dispatch to active orchestration at the grid edge, and the shift is no longer theoretical. Rooftop solar, batteries, electric vehicles, flexible commercial loads, smart thermostats, and backup generators are becoming dispatchable grid resources. Nexvora Intelligence estimates the global Virtual Power Plants and Distributed Energy Resource Management Systems market at approximately $•••–••• billion in 2025, covering software platforms, integration services, managed aggregation operations, and recurring orchestration revenues.
The market’s center of gravity is changing. Early activity was concentrated in utility pilots and demand-response programs; the next phase is defined by scaled DER enrollment, distribution-level visibility, capacity market participation, and grid constraint management. VPPs are becoming commercial instruments, while DERMS is becoming operational infrastructure for utilities that need to coordinate non-wires alternatives, interconnection queues, feeder constraints, and distributed flexibility.
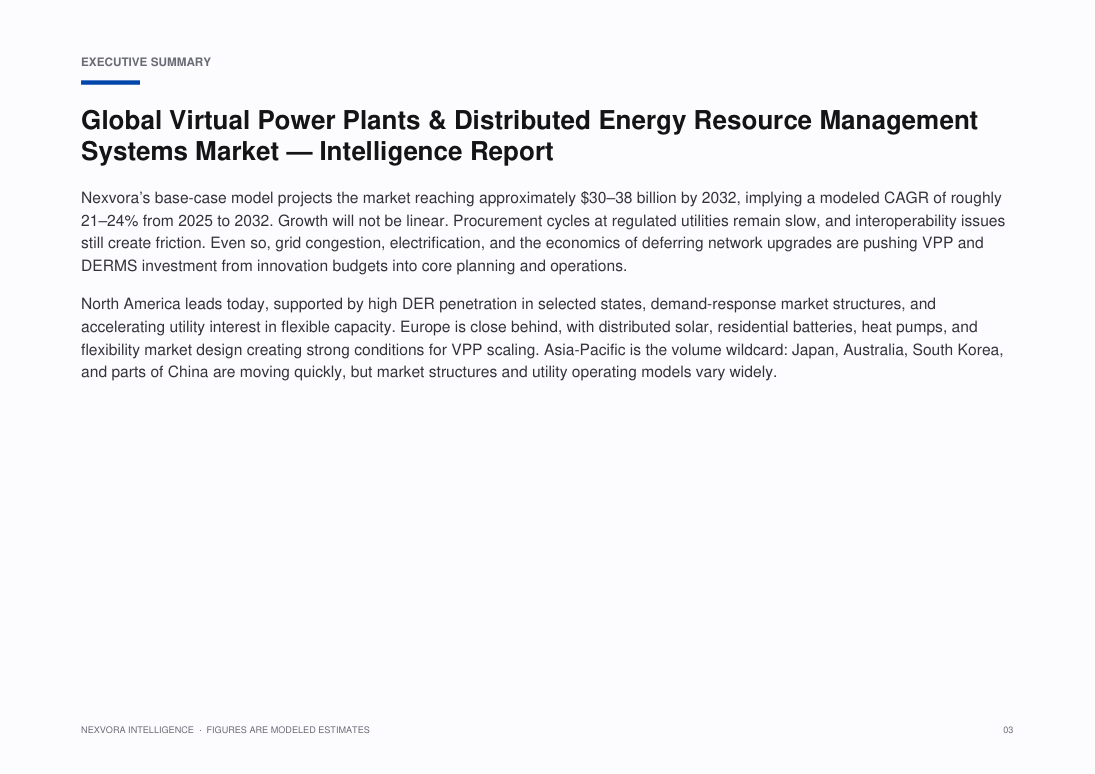
Nexvora’s base-case model projects the market reaching approximately $•••–••• billion by 2032, implying a modeled CAGR of roughly 21–••% from 2025 to 2032. Growth will not be linear. Procurement cycles at regulated utilities remain slow, and interoperability issues still create friction. Even so, grid congestion, electrification, and the economics of deferring network upgrades are pushing VPP and DERMS investment from innovation budgets into core planning and operations.
North America leads today, supported by high DER penetration in selected states, demand-response market structures, and accelerating utility interest in flexible capacity. Europe is close behind, with distributed solar, residential batteries, heat pumps, and flexibility market design creating strong conditions for VPP scaling. Asia-Pacific is the volume wildcard: Japan, Australia, South Korea, and parts of China are moving quickly, but market structures and utility operating models vary widely.
Specific figures are hidden in this free preview. Unlock the report to see all modeled market sizes, forecasts and growth rates.
What this report covers.
Proprietary market outlook for grid orchestration platforms, VPP aggregation, and DERMS deployments, 2025–2032
Who this report is for.
- Corporate strategy, planning and M&A teams evaluating the market
- Investors, private equity and venture teams sizing the opportunity
- Product, marketing and go-to-market leaders
- Consultants and analysts building the competitive picture
- Executives planning market entry, expansion or investment
How this report is built.
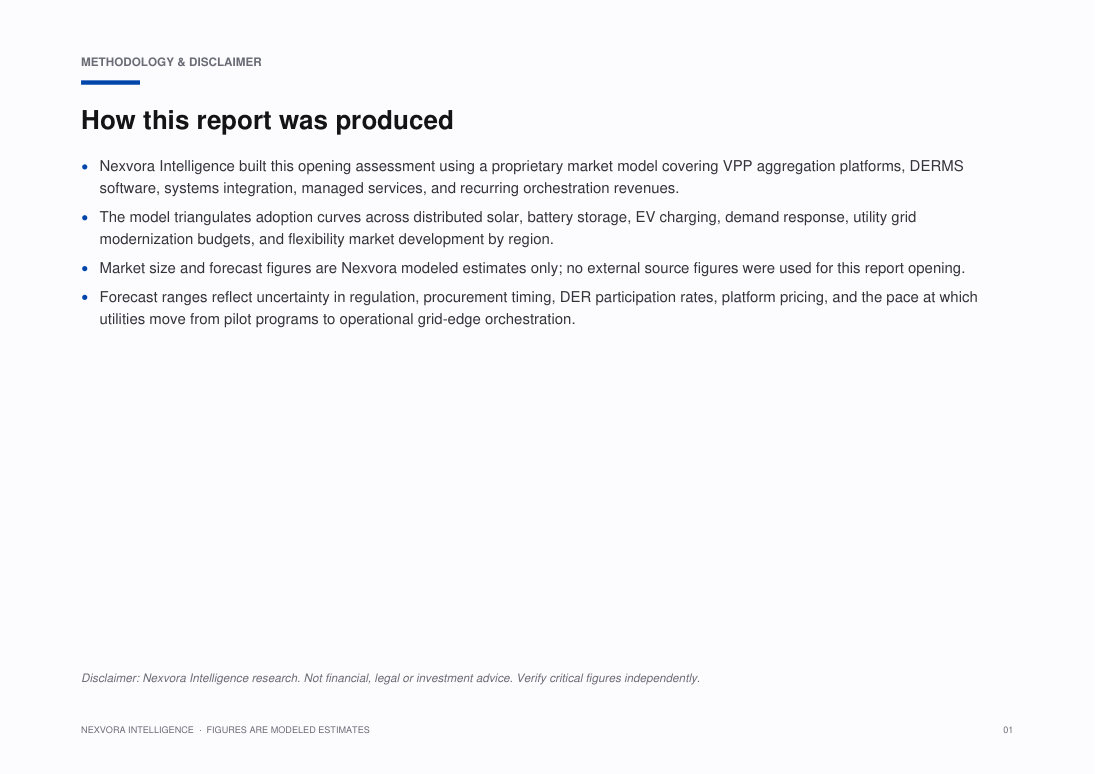
Nexvora Intelligence built this opening assessment using a proprietary market model covering VPP aggregation platforms, DERMS software, systems integration, managed services, and recurring orchestration revenues.
The model triangulates adoption curves across distributed solar, battery storage, EV charging, demand response, utility grid modernization budgets, and flexibility market development by region.
Market size and forecast figures are Nexvora modeled estimates only; no external source figures were used for this report opening.
Forecast ranges reflect uncertainty in regulation, procurement timing, DER participation rates, platform pricing, and the pace at which utilities move from pilot programs to operational grid-edge orchestration.
What's inside — a number-free look.
A full outline of the figures and tables you'll get. Specific data, market sizes and forecasts are unlocked with purchase.
List of Figures
- Figure 1: Market Overview and Structure — Virtual Power Plants & Distributed Energy Resource Management Systems
- Figure 2: Market Size and Forecast Framework — Virtual Power Plants & Distributed Energy Resource Management Systems
- Figure 3: Value Chain and Ecosystem Analysis — Virtual Power Plants & Distributed Energy Resource Management Systems
- Figure 4: Market Dynamics — Drivers, Restraints and Opportunities — Virtual Power Plants & Distributed Energy Resource Management Systems
- Figure 5: Segment Contribution Analysis — Virtual Power Plants & Distributed Energy Resource Management Systems
- Figure 6: Regional Market Landscape — Virtual Power Plants & Distributed Energy Resource Management Systems
- Figure 7: Country-level Opportunity Mapping — Virtual Power Plants & Distributed Energy Resource Management Systems
- Figure 8: Competitive Positioning Matrix — Virtual Power Plants & Distributed Energy Resource Management Systems
- Figure 9: Market Share of Leading Players — Virtual Power Plants & Distributed Energy Resource Management Systems
- Figure 10: Adoption and Penetration Trends — Virtual Power Plants & Distributed Energy Resource Management Systems
- Figure 11: Technology and Innovation Landscape — Virtual Power Plants & Distributed Energy Resource Management Systems
- Figure 12: Pricing and Business Model Analysis — Virtual Power Plants & Distributed Energy Resource Management Systems
- Figure 13: Investment, Funding and M&A Landscape — Virtual Power Plants & Distributed Energy Resource Management Systems
- Figure 14: Regulatory and Policy Framework — Virtual Power Plants & Distributed Energy Resource Management Systems
- Figure 15: Porter's Five Forces Analysis — Virtual Power Plants & Distributed Energy Resource Management Systems
- Figure 16: PESTLE Analysis — Virtual Power Plants & Distributed Energy Resource Management Systems
- Figure 17: Growth Opportunity Heat Map — Virtual Power Plants & Distributed Energy Resource Management Systems
- Figure 18: Future Outlook and Strategic Roadmap — Virtual Power Plants & Distributed Energy Resource Management Systems
List of Tables
- Table 1: Market Segmentation Overview — Virtual Power Plants & Distributed Energy Resource Management Systems
- Table 2: Segment Definitions and Scope — Virtual Power Plants & Distributed Energy Resource Management Systems
- Table 3: Regional and Country Coverage Summary — Virtual Power Plants & Distributed Energy Resource Management Systems
- Table 4: Key Company Profiles and Offerings — Virtual Power Plants & Distributed Energy Resource Management Systems
- Table 5: Competitive Benchmarking Matrix — Virtual Power Plants & Distributed Energy Resource Management Systems
- Table 6: Product and Service Portfolio Mapping — Virtual Power Plants & Distributed Energy Resource Management Systems
- Table 7: Market Drivers, Restraints and Trends — Virtual Power Plants & Distributed Energy Resource Management Systems
- Table 8: Strategic Initiatives and Developments — Virtual Power Plants & Distributed Energy Resource Management Systems
- Table 9: Partnerships and Collaborations — Virtual Power Plants & Distributed Energy Resource Management Systems
- Table 10: Research Assumptions and Limitations — Virtual Power Plants & Distributed Energy Resource Management Systems
- Table 11: Data Sources and References — Virtual Power Plants & Distributed Energy Resource Management Systems
- Table 12: Report Scope and Coverage Summary — Virtual Power Plants & Distributed Energy Resource Management Systems
A look at the pages.
107 pages · 20 sections · charts & tables
A genuine peek at the opening pages. Unlock to read every page in full.
6 of 107 pages shown
Turn this market into a plan for your business.
Answer a few quick questions and unlock a personalised operational read — your maturity score, prioritised focus areas and quick wins — mapped to where this market is heading. Result delivered instantly and emailed to you.
- Maturity score & prioritised focus areas
- Practical quick wins and a recommended next step
Questions, answered.
How big is the Global Virtual Power Plants & Distributed Energy Resource Management Systems Market?
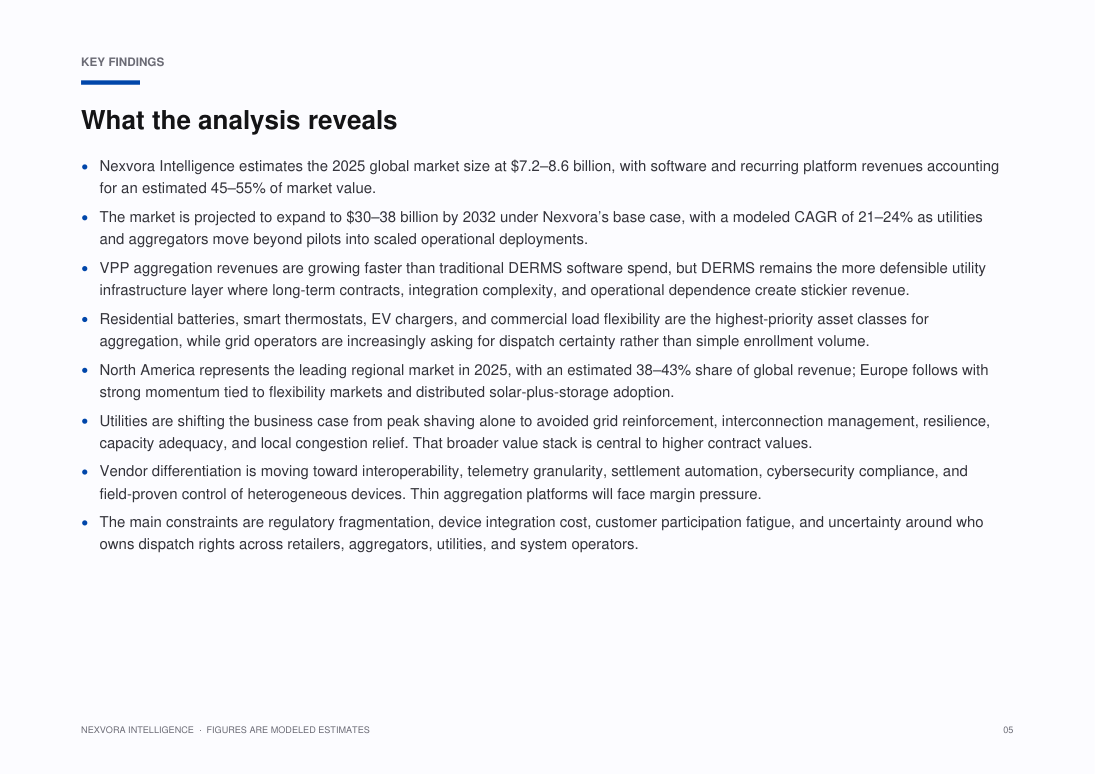
Nexvora models the Global Virtual Power Plants & Distributed Energy Resource Management Systems Market at approximately $7.2–8.6B in 2025. Full market sizing, segmentation and forecasts are inside the report (modeled estimate).
What is the growth rate (CAGR) of the Global Virtual Power Plants & Distributed Energy Resource Management Systems Market?
The Global Virtual Power Plants & Distributed Energy Resource Management Systems Market is projected to grow at a CAGR of about 21–24% through 2032 over the forecast period — a Nexvora modeled estimate detailed across the report's 20 sections.
What does this report include?
A complete market intelligence report — market sizing and forecasts, segmentation, regional and industry analysis, competitive landscape, trends, and strategic recommendations across 20 sections.
How do I access it after purchase?
Instantly, in your secure online viewer. Reports are view-only and available on any device from your library.
Are the figures sourced?
Quantitative figures are Nexvora modeled estimates unless explicitly cited to a referenced source within the report.
Can I buy access for my team?
Yes — add user seats at checkout, or subscribe for bulk access across multiple reports.
Nexvora Intelligence research report. All quantitative figures are modeled estimates — not audited data. Not financial or investment advice.
Grid-Scale Battery Storage vs Lithium-Ion Battery Energy Storage Systems
Choose Grid-Scale Battery Storage from Fluence if you specifically need a stationary, grid-connected system for renewable integration, grid services, peak shifting, or capacity support. Choose CATL’s Lithium-Ion Battery Energy Storage Systems only if the lithium-ion system category or vendor fit is your main priority, because its deployment type and primary applications are not publicly disclosed here. With key capacity, power, chemistry, and release-year details missing for both, the right choice ultimately depends on the buyer’s project requirements and vendor priorities.
Grounded in published specifications — guidance, not an endorsement.
More market reports
Keep exploring intelligence in this and related sectors.

Global Direct Air Capture & Carbon Removal Credits Market — Intelligence Report

Global High-Density Data Center Power Procurement & Behind-the-Meter Generation Market — Intelligence Report
Global Grid Interconnection & Power Infrastructure for High-Density Data Centers — Intelligence Report
Global Small Modular Nuclear Reactors for Industrial and Data Center Power Market — Intelligence Report
AI Analyst
Insights and answers generated live from Global Virtual Power Plants & Distributed Energy Resource Management Systems Market — Intelligence Report's verified data. Modeled estimates — not investment advice.
- The report covers the Global Virtual Power Plants & Distributed Energy Resource Management Systems Market in the Energy & Sustainability sector.
- The market outlook focuses on grid orchestration platforms, VPP aggregation, and DERMS deployments.
- The report period spans 2025–2032.
- Notable: The report is positioned as a proprietary Nexvora Intelligence market outlook.