
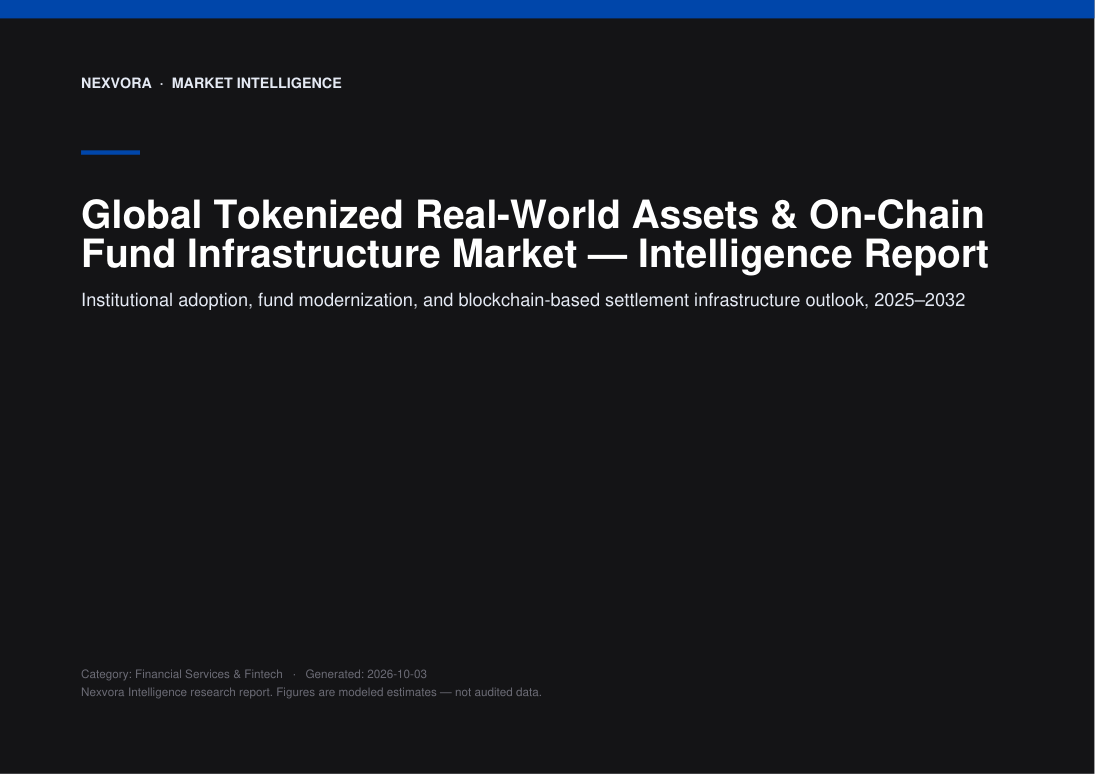
Global Tokenized Real-World Assets & On-Chain Fund Infrastructure Market — Intelligence Report
Institutional adoption, fund modernization, and blockchain-based settlement infrastructure outlook, 2025–2032
Nexvora Intelligence market report on Global Tokenized Real-World Assets & On-Chain Fund Infrastructure Market.
per extra user
Instant access after payment. Secure via Razorpay.
The opening view — free.
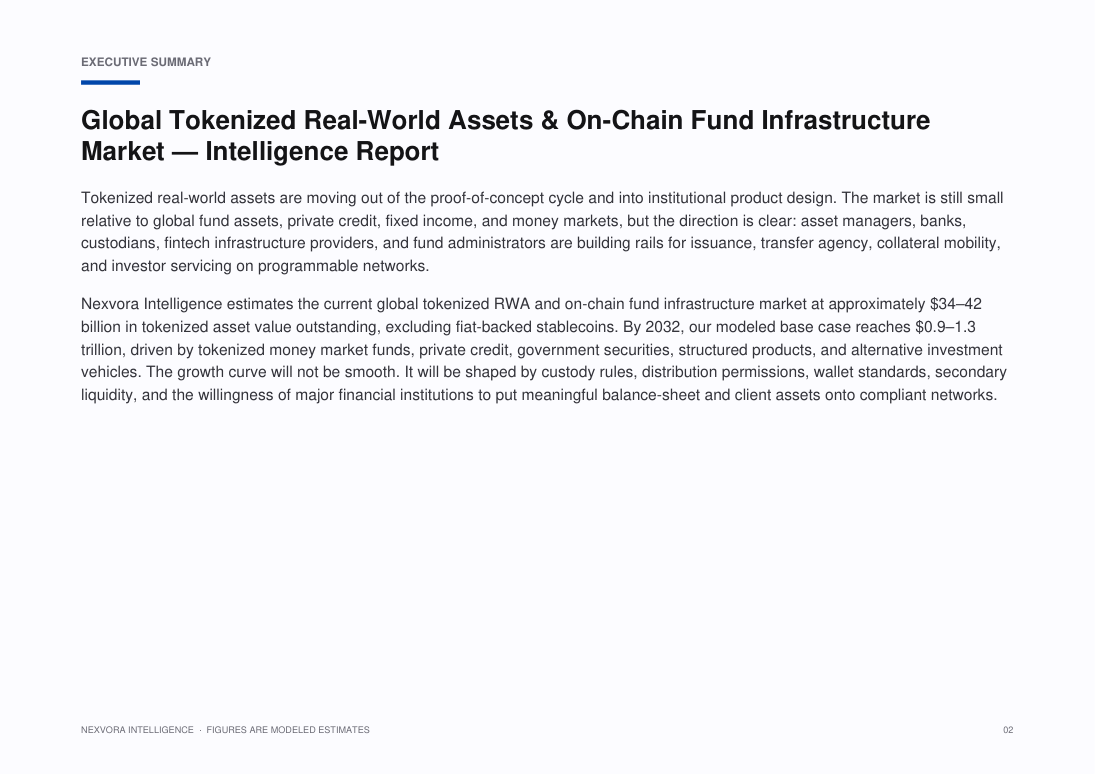
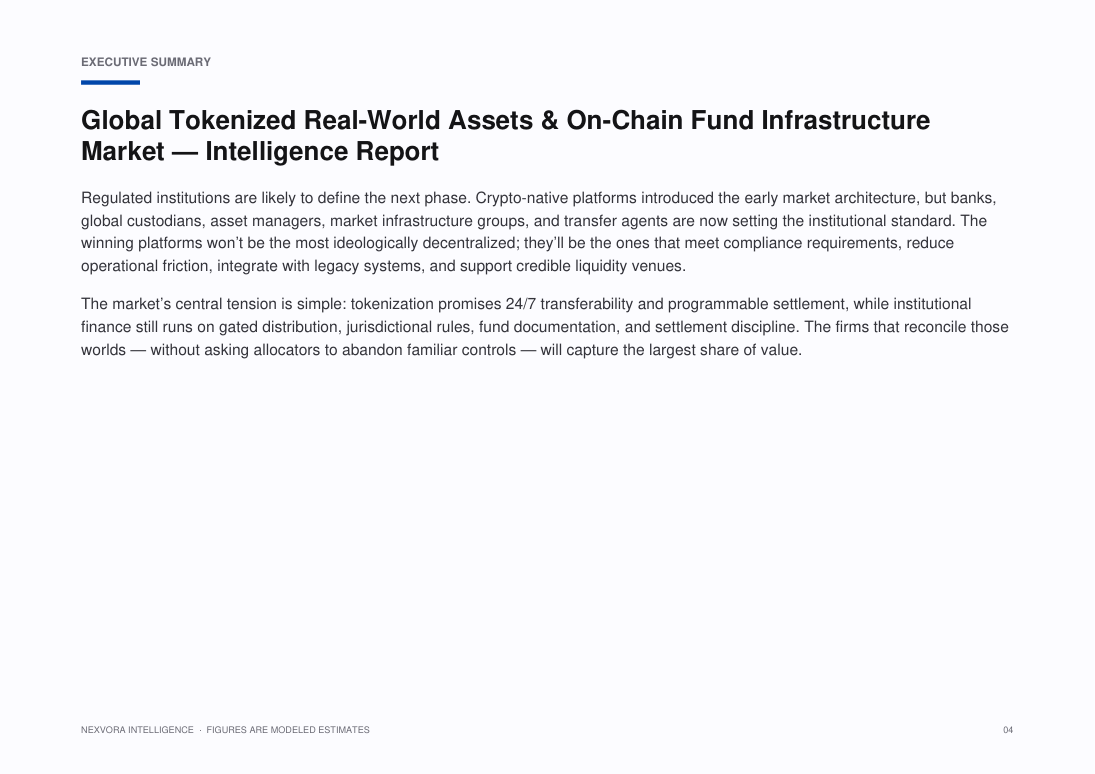
Tokenized real-world assets are moving out of the proof-of-concept cycle and into institutional product design. The market is still small relative to global fund assets, private credit, fixed income, and money markets, but the direction is clear: asset managers, banks, custodians, fintech infrastructure providers, and fund administrators are building rails for issuance, transfer agency, collateral mobility, and investor servicing on programmable networks.
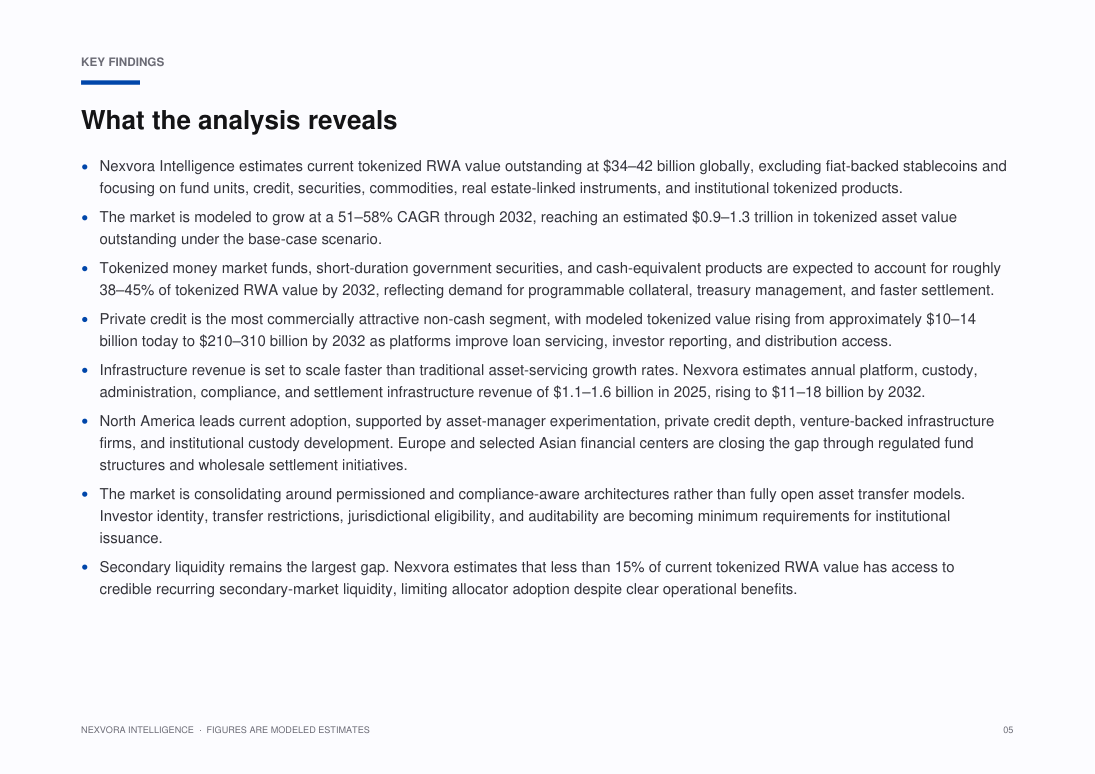
Nexvora Intelligence estimates the current global tokenized RWA and on-chain fund infrastructure market at approximately $•••–••• billion in tokenized asset value outstanding, excluding fiat-backed stablecoins. By 2032, our modeled base case reaches $•••–••• trillion, driven by tokenized money market funds, private credit, government securities, structured products, and alternative investment vehicles. The growth curve will not be smooth. It will be shaped by custody rules, distribution permissions, wallet standards, secondary liquidity, and the willingness of major financial institutions to put meaningful balance-sheet and client assets onto compliant networks.
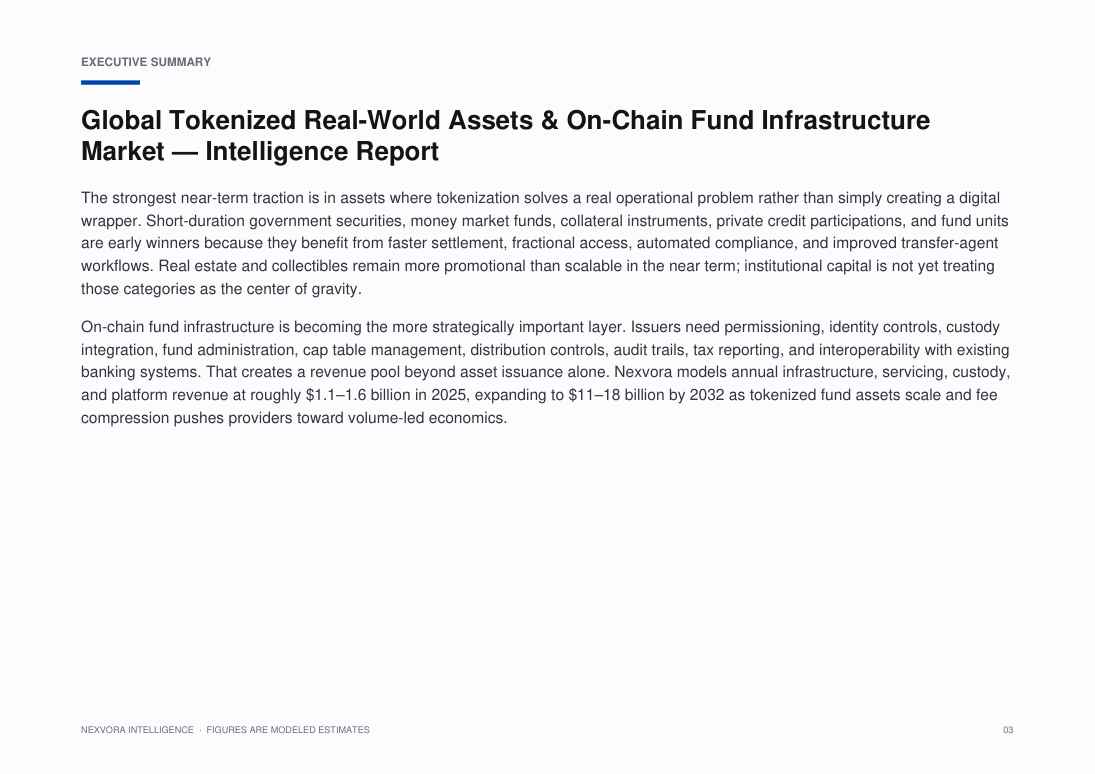
The strongest near-term traction is in assets where tokenization solves a real operational problem rather than simply creating a digital wrapper. Short-duration government securities, money market funds, collateral instruments, private credit participations, and fund units are early winners because they benefit from faster settlement, fractional access, automated compliance, and improved transfer-agent workflows. Real estate and collectibles remain more promotional than scalable in the near term; institutional capital is not yet treating those categories as the center of gravity.
On-chain fund infrastructure is becoming the more strategically important layer. Issuers need permissioning, identity controls, custody integration, fund administration, cap table management, distribution controls, audit trails, tax reporting, and interoperability with existing banking systems. That creates a revenue pool beyond asset issuance alone. Nexvora models annual infrastructure, servicing, custody, and platform revenue at roughly $•••–••• billion in 2025, expanding to $•••–••• billion by 2032 as tokenized fund assets scale and fee compression pushes providers toward volume-led economics.
Specific figures are hidden in this free preview. Unlock the report to see all modeled market sizes, forecasts and growth rates.
What this report covers.
Institutional adoption, fund modernization, and blockchain-based settlement infrastructure outlook, 2025–2032
Who this report is for.
- Corporate strategy, planning and M&A teams evaluating the market
- Investors, private equity and venture teams sizing the opportunity
- Product, marketing and go-to-market leaders
- Consultants and analysts building the competitive picture
- Executives planning market entry, expansion or investment
How this report is built.
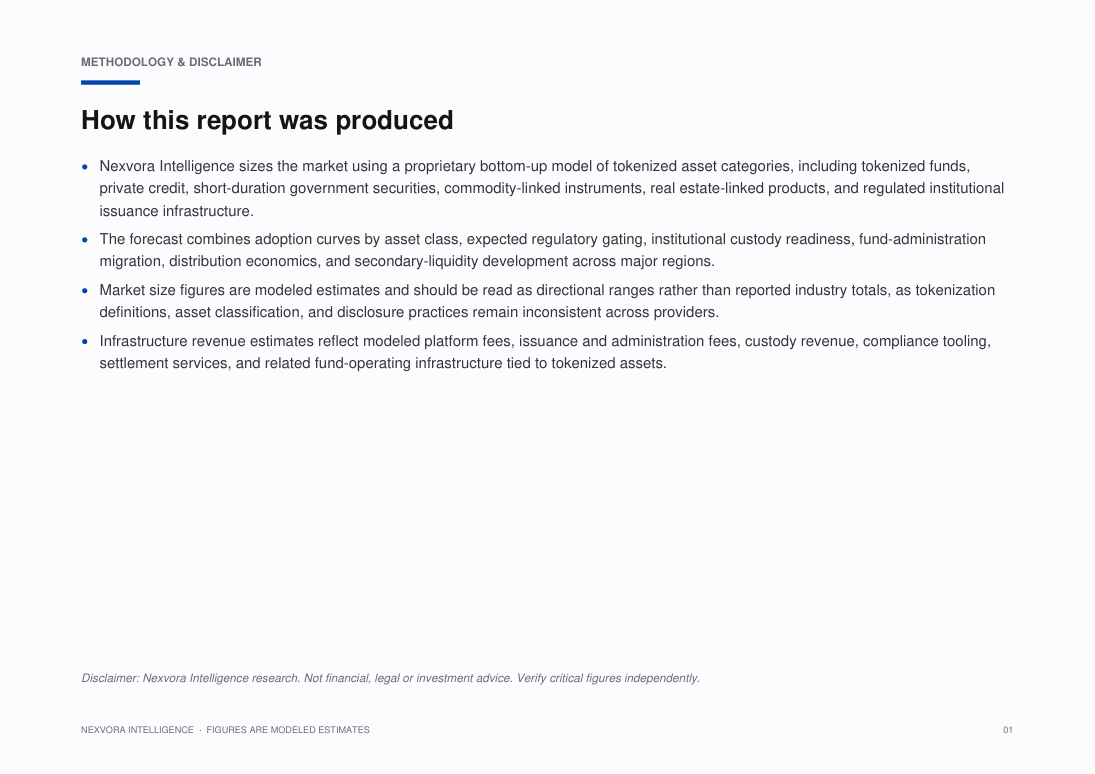
Nexvora Intelligence sizes the market using a proprietary bottom-up model of tokenized asset categories, including tokenized funds, private credit, short-duration government securities, commodity-linked instruments, real estate-linked products, and regulated institutional issuance infrastructure.
The forecast combines adoption curves by asset class, expected regulatory gating, institutional custody readiness, fund-administration migration, distribution economics, and secondary-liquidity development across major regions.
Market size figures are modeled estimates and should be read as directional ranges rather than reported industry totals, as tokenization definitions, asset classification, and disclosure practices remain inconsistent across providers.
Infrastructure revenue estimates reflect modeled platform fees, issuance and administration fees, custody revenue, compliance tooling, settlement services, and related fund-operating infrastructure tied to tokenized assets.
What's inside — a number-free look.
A full outline of the figures and tables you'll get. Specific data, market sizes and forecasts are unlocked with purchase.
List of Figures
- Figure 1: Market Overview and Structure — Tokenized Real-World Assets & On-Chain Fund Infrastructure
- Figure 2: Market Size and Forecast Framework — Tokenized Real-World Assets & On-Chain Fund Infrastructure
- Figure 3: Value Chain and Ecosystem Analysis — Tokenized Real-World Assets & On-Chain Fund Infrastructure
- Figure 4: Market Dynamics — Drivers, Restraints and Opportunities — Tokenized Real-World Assets & On-Chain Fund Infrastructure
- Figure 5: Segment Contribution Analysis — Tokenized Real-World Assets & On-Chain Fund Infrastructure
- Figure 6: Regional Market Landscape — Tokenized Real-World Assets & On-Chain Fund Infrastructure
- Figure 7: Country-level Opportunity Mapping — Tokenized Real-World Assets & On-Chain Fund Infrastructure
- Figure 8: Competitive Positioning Matrix — Tokenized Real-World Assets & On-Chain Fund Infrastructure
- Figure 9: Market Share of Leading Players — Tokenized Real-World Assets & On-Chain Fund Infrastructure
- Figure 10: Adoption and Penetration Trends — Tokenized Real-World Assets & On-Chain Fund Infrastructure
- Figure 11: Technology and Innovation Landscape — Tokenized Real-World Assets & On-Chain Fund Infrastructure
- Figure 12: Pricing and Business Model Analysis — Tokenized Real-World Assets & On-Chain Fund Infrastructure
- Figure 13: Investment, Funding and M&A Landscape — Tokenized Real-World Assets & On-Chain Fund Infrastructure
- Figure 14: Regulatory and Policy Framework — Tokenized Real-World Assets & On-Chain Fund Infrastructure
- Figure 15: Porter's Five Forces Analysis — Tokenized Real-World Assets & On-Chain Fund Infrastructure
- Figure 16: PESTLE Analysis — Tokenized Real-World Assets & On-Chain Fund Infrastructure
- Figure 17: Growth Opportunity Heat Map — Tokenized Real-World Assets & On-Chain Fund Infrastructure
- Figure 18: Future Outlook and Strategic Roadmap — Tokenized Real-World Assets & On-Chain Fund Infrastructure
List of Tables
- Table 1: Market Segmentation Overview — Tokenized Real-World Assets & On-Chain Fund Infrastructure
- Table 2: Segment Definitions and Scope — Tokenized Real-World Assets & On-Chain Fund Infrastructure
- Table 3: Regional and Country Coverage Summary — Tokenized Real-World Assets & On-Chain Fund Infrastructure
- Table 4: Key Company Profiles and Offerings — Tokenized Real-World Assets & On-Chain Fund Infrastructure
- Table 5: Competitive Benchmarking Matrix — Tokenized Real-World Assets & On-Chain Fund Infrastructure
- Table 6: Product and Service Portfolio Mapping — Tokenized Real-World Assets & On-Chain Fund Infrastructure
- Table 7: Market Drivers, Restraints and Trends — Tokenized Real-World Assets & On-Chain Fund Infrastructure
- Table 8: Strategic Initiatives and Developments — Tokenized Real-World Assets & On-Chain Fund Infrastructure
- Table 9: Partnerships and Collaborations — Tokenized Real-World Assets & On-Chain Fund Infrastructure
- Table 10: Research Assumptions and Limitations — Tokenized Real-World Assets & On-Chain Fund Infrastructure
- Table 11: Data Sources and References — Tokenized Real-World Assets & On-Chain Fund Infrastructure
- Table 12: Report Scope and Coverage Summary — Tokenized Real-World Assets & On-Chain Fund Infrastructure
A look at the pages.
109 pages · 20 sections · charts & tables
A genuine peek at the opening pages. Unlock to read every page in full.
6 of 109 pages shown
Turn this market into a plan for your business.
Answer a few quick questions and unlock a personalised operational read — your maturity score, prioritised focus areas and quick wins — mapped to where this market is heading. Result delivered instantly and emailed to you.
- Maturity score & prioritised focus areas
- Practical quick wins and a recommended next step
Questions, answered.
How big is the Global Tokenized Real-World Assets & On-Chain Fund Infrastructure Market?
Nexvora models the Global Tokenized Real-World Assets & On-Chain Fund Infrastructure Market at approximately $34–42B. Full market sizing, segmentation and forecasts are inside the report (modeled estimate).
What is the growth rate (CAGR) of the Global Tokenized Real-World Assets & On-Chain Fund Infrastructure Market?
The Global Tokenized Real-World Assets & On-Chain Fund Infrastructure Market is projected to grow at a CAGR of about 51–58% over the forecast period — a Nexvora modeled estimate detailed across the report's 20 sections.
What does this report include?
A complete market intelligence report — market sizing and forecasts, segmentation, regional and industry analysis, competitive landscape, trends, and strategic recommendations across 20 sections.
How do I access it after purchase?
Instantly, in your secure online viewer. Reports are view-only and available on any device from your library.
Are the figures sourced?
Quantitative figures are Nexvora modeled estimates unless explicitly cited to a referenced source within the report.
Can I buy access for my team?
Yes — add user seats at checkout, or subscribe for bulk access across multiple reports.
Nexvora Intelligence research report. All quantitative figures are modeled estimates — not audited data. Not financial or investment advice.
Enterprise Resource Planning Software vs Cloud Infrastructure Services
Choose Enterprise Resource Planning Software from SAP if you need ERP software from the SAP S/4HANA and SAP ERP portfolio, with cloud and on-premises options available. Choose Cloud Infrastructure Services from Amazon Web Services if you need public cloud infrastructure services using IaaS or PaaS, managed through the AWS Management Console, AWS CLI, SDKs, or APIs. The right choice depends on whether your priority is ERP software or cloud infrastructure.
Grounded in published specifications — guidance, not an endorsement.
More market reports
Keep exploring intelligence in this and related sectors.
Global Stablecoin Payments & Digital Treasury Infrastructure Market — Intelligence Report
Global Instant Payments & Account-to-Account Commerce Market — Intelligence Report

Global Tokenized Real-World Assets Market — Intelligence Report
Global Stablecoin Payments & Tokenized Deposits Market — Intelligence Report
AI Analyst
Insights and answers generated live from Global Tokenized Real-World Assets & On-Chain Fund Infrastructure Market — Intelligence Report's verified data. Modeled estimates — not investment advice.