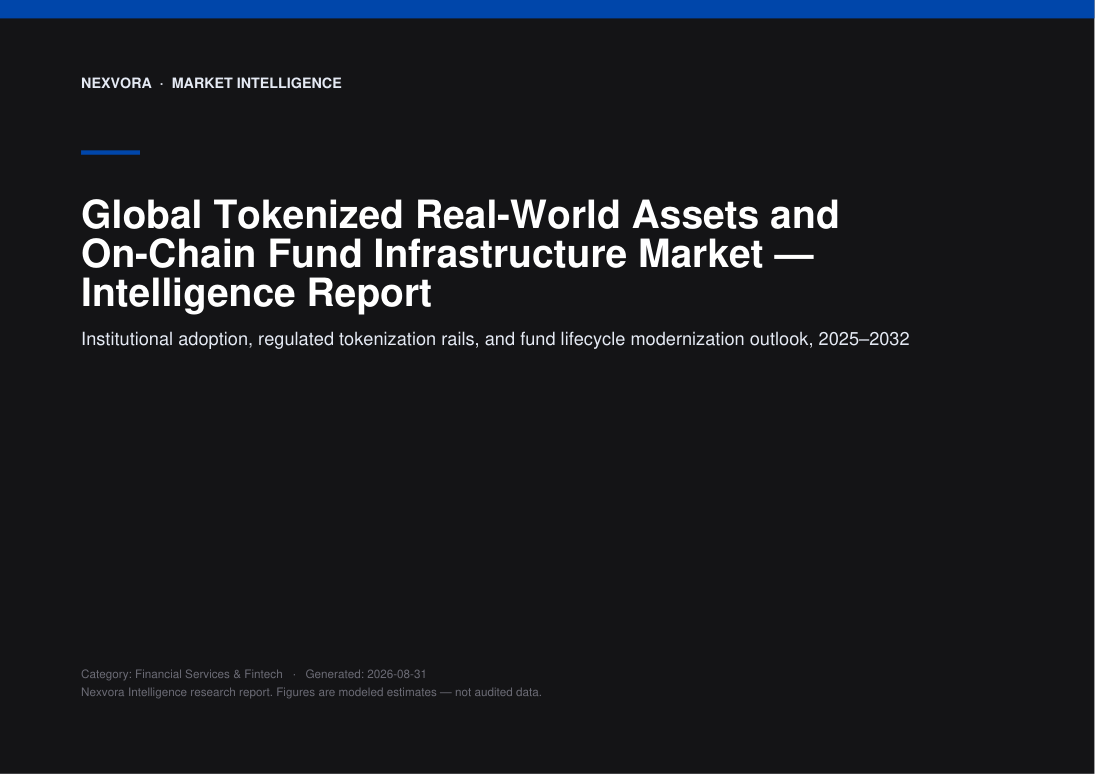
Global Tokenized Real-World Assets and On-Chain Fund Infrastructure Market — Intelligence Report
Institutional adoption, regulated tokenization rails, and fund lifecycle modernization outlook, 2025–2032
Nexvora Intelligence market report on Global Tokenized Real-World Assets and On-Chain Fund Infrastructure Market.
per extra user
Instant access after payment. Secure via Razorpay.
The opening view — free.
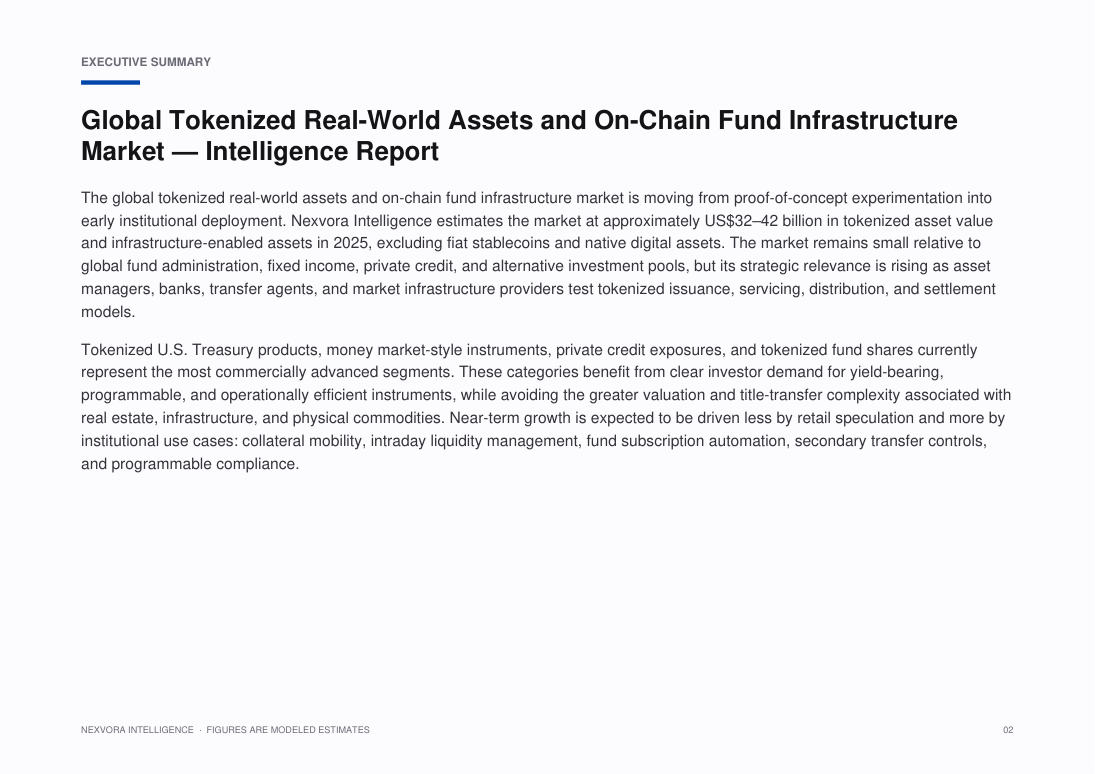
The global tokenized real-world assets and on-chain fund infrastructure market is moving from proof-of-concept experimentation into early institutional deployment. Nexvora Intelligence estimates the market at approximately US$•••–••• billion in tokenized asset value and infrastructure-enabled assets in 2025, excluding fiat stablecoins and native digital assets. The market remains small relative to global fund administration, fixed income, private credit, and alternative investment pools, but its strategic relevance is rising as asset managers, banks, transfer agents, and market infrastructure providers test tokenized issuance, servicing, distribution, and settlement models.
Tokenized U.S. Treasury products, money market-style instruments, private credit exposures, and tokenized fund shares currently represent the most commercially advanced segments. These categories benefit from clear investor demand for yield-bearing, programmable, and operationally efficient instruments, while avoiding the greater valuation and title-transfer complexity associated with real estate, infrastructure, and physical commodities. Near-term growth is expected to be driven less by retail speculation and more by institutional use cases: collateral mobility, intraday liquidity management, fund subscription automation, secondary transfer controls, and programmable compliance.
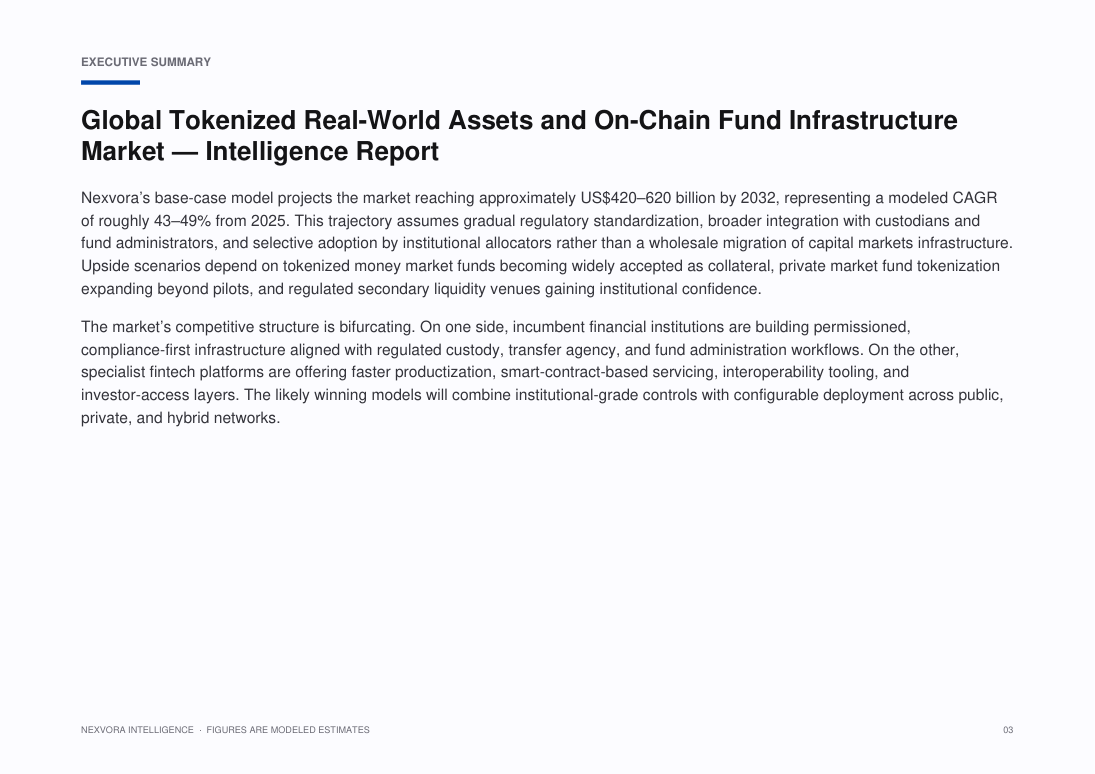
Nexvora’s base-case model projects the market reaching approximately US$•••–••• billion by 2032, representing a modeled CAGR of roughly 43–••% from 2025. This trajectory assumes gradual regulatory standardization, broader integration with custodians and fund administrators, and selective adoption by institutional allocators rather than a wholesale migration of capital markets infrastructure. Upside scenarios depend on tokenized money market funds becoming widely accepted as collateral, private market fund tokenization expanding beyond pilots, and regulated secondary liquidity venues gaining institutional confidence.
The market’s competitive structure is bifurcating. On one side, incumbent financial institutions are building permissioned, compliance-first infrastructure aligned with regulated custody, transfer agency, and fund administration workflows. On the other, specialist fintech platforms are offering faster productization, smart-contract-based servicing, interoperability tooling, and investor-access layers. The likely winning models will combine institutional-grade controls with configurable deployment across public, private, and hybrid networks.
Specific figures are hidden in this free preview. Unlock the report to see all modeled market sizes, forecasts and growth rates.
What this report covers.
Institutional adoption, regulated tokenization rails, and fund lifecycle modernization outlook, 2025–2032
Who this report is for.
- Corporate strategy, planning and M&A teams evaluating the market
- Investors, private equity and venture teams sizing the opportunity
- Product, marketing and go-to-market leaders
- Consultants and analysts building the competitive picture
- Executives planning market entry, expansion or investment
How this report is built.
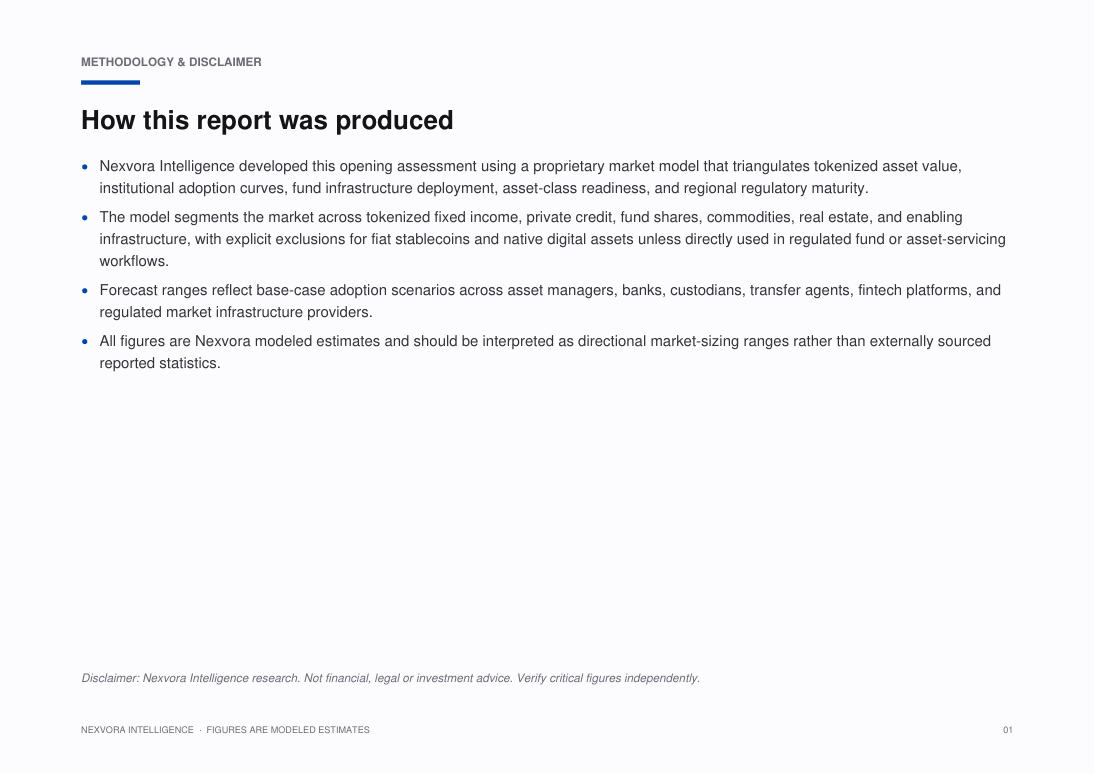
Nexvora Intelligence developed this opening assessment using a proprietary market model that triangulates tokenized asset value, institutional adoption curves, fund infrastructure deployment, asset-class readiness, and regional regulatory maturity.
The model segments the market across tokenized fixed income, private credit, fund shares, commodities, real estate, and enabling infrastructure, with explicit exclusions for fiat stablecoins and native digital assets unless directly used in regulated fund or asset-servicing workflows.
Forecast ranges reflect base-case adoption scenarios across asset managers, banks, custodians, transfer agents, fintech platforms, and regulated market infrastructure providers.
All figures are Nexvora modeled estimates and should be interpreted as directional market-sizing ranges rather than externally sourced reported statistics.
What's inside — a number-free look.
A full outline of the figures and tables you'll get. Specific data, market sizes and forecasts are unlocked with purchase.
List of Figures
- Figure 1: Market Overview and Structure — Tokenized Real-World Assets and On-Chain Fund Infrastructure
- Figure 2: Market Size and Forecast Framework — Tokenized Real-World Assets and On-Chain Fund Infrastructure
- Figure 3: Value Chain and Ecosystem Analysis — Tokenized Real-World Assets and On-Chain Fund Infrastructure
- Figure 4: Market Dynamics — Drivers, Restraints and Opportunities — Tokenized Real-World Assets and On-Chain Fund Infrastructure
- Figure 5: Segment Contribution Analysis — Tokenized Real-World Assets and On-Chain Fund Infrastructure
- Figure 6: Regional Market Landscape — Tokenized Real-World Assets and On-Chain Fund Infrastructure
- Figure 7: Country-level Opportunity Mapping — Tokenized Real-World Assets and On-Chain Fund Infrastructure
- Figure 8: Competitive Positioning Matrix — Tokenized Real-World Assets and On-Chain Fund Infrastructure
- Figure 9: Market Share of Leading Players — Tokenized Real-World Assets and On-Chain Fund Infrastructure
- Figure 10: Adoption and Penetration Trends — Tokenized Real-World Assets and On-Chain Fund Infrastructure
- Figure 11: Technology and Innovation Landscape — Tokenized Real-World Assets and On-Chain Fund Infrastructure
- Figure 12: Pricing and Business Model Analysis — Tokenized Real-World Assets and On-Chain Fund Infrastructure
- Figure 13: Investment, Funding and M&A Landscape — Tokenized Real-World Assets and On-Chain Fund Infrastructure
- Figure 14: Regulatory and Policy Framework — Tokenized Real-World Assets and On-Chain Fund Infrastructure
- Figure 15: Porter's Five Forces Analysis — Tokenized Real-World Assets and On-Chain Fund Infrastructure
- Figure 16: PESTLE Analysis — Tokenized Real-World Assets and On-Chain Fund Infrastructure
- Figure 17: Growth Opportunity Heat Map — Tokenized Real-World Assets and On-Chain Fund Infrastructure
- Figure 18: Future Outlook and Strategic Roadmap — Tokenized Real-World Assets and On-Chain Fund Infrastructure
List of Tables
- Table 1: Market Segmentation Overview — Tokenized Real-World Assets and On-Chain Fund Infrastructure
- Table 2: Segment Definitions and Scope — Tokenized Real-World Assets and On-Chain Fund Infrastructure
- Table 3: Regional and Country Coverage Summary — Tokenized Real-World Assets and On-Chain Fund Infrastructure
- Table 4: Key Company Profiles and Offerings — Tokenized Real-World Assets and On-Chain Fund Infrastructure
- Table 5: Competitive Benchmarking Matrix — Tokenized Real-World Assets and On-Chain Fund Infrastructure
- Table 6: Product and Service Portfolio Mapping — Tokenized Real-World Assets and On-Chain Fund Infrastructure
- Table 7: Market Drivers, Restraints and Trends — Tokenized Real-World Assets and On-Chain Fund Infrastructure
- Table 8: Strategic Initiatives and Developments — Tokenized Real-World Assets and On-Chain Fund Infrastructure
- Table 9: Partnerships and Collaborations — Tokenized Real-World Assets and On-Chain Fund Infrastructure
- Table 10: Research Assumptions and Limitations — Tokenized Real-World Assets and On-Chain Fund Infrastructure
- Table 11: Data Sources and References — Tokenized Real-World Assets and On-Chain Fund Infrastructure
- Table 12: Report Scope and Coverage Summary — Tokenized Real-World Assets and On-Chain Fund Infrastructure
A look at the pages.
107 pages · 20 sections · charts & tables
A genuine peek at the opening pages. Unlock to read every page in full.
6 of 107 pages shown
Turn this market into a plan for your business.
Answer a few quick questions and unlock a personalised operational read — your maturity score, prioritised focus areas and quick wins — mapped to where this market is heading. Result delivered instantly and emailed to you.
- Maturity score & prioritised focus areas
- Practical quick wins and a recommended next step
Questions, answered.
How big is the Global Tokenized Real-World Assets and On-Chain Fund Infrastructure Market?
Nexvora models the Global Tokenized Real-World Assets and On-Chain Fund Infrastructure Market at approximately US$32–42B. Full market sizing, segmentation and forecasts are inside the report (modeled estimate).
What is the growth rate (CAGR) of the Global Tokenized Real-World Assets and On-Chain Fund Infrastructure Market?
The Global Tokenized Real-World Assets and On-Chain Fund Infrastructure Market is projected to grow at a CAGR of about 43–49% over the forecast period — a Nexvora modeled estimate detailed across the report's 20 sections.
What does this report include?
A complete market intelligence report — market sizing and forecasts, segmentation, regional and industry analysis, competitive landscape, trends, and strategic recommendations across 20 sections.
How do I access it after purchase?
Instantly, in your secure online viewer. Reports are view-only and available on any device from your library.
Are the figures sourced?
Quantitative figures are Nexvora modeled estimates unless explicitly cited to a referenced source within the report.
Can I buy access for my team?
Yes — add user seats at checkout, or subscribe for bulk access across multiple reports.
Nexvora Intelligence research report. All quantitative figures are modeled estimates — not audited data. Not financial or investment advice.
More market reports
Keep exploring intelligence in this and related sectors.

Global Stablecoin Payments & Tokenized Deposits Market — Intelligence Report
Global Instant Account-to-Account Payments, Pay-by-Bank and Open Banking Infrastructure Market — Intelligence Report
Global Stablecoin Payments, Tokenized Deposits and Real-Time Treasury Infrastructure Market — Intelligence Report