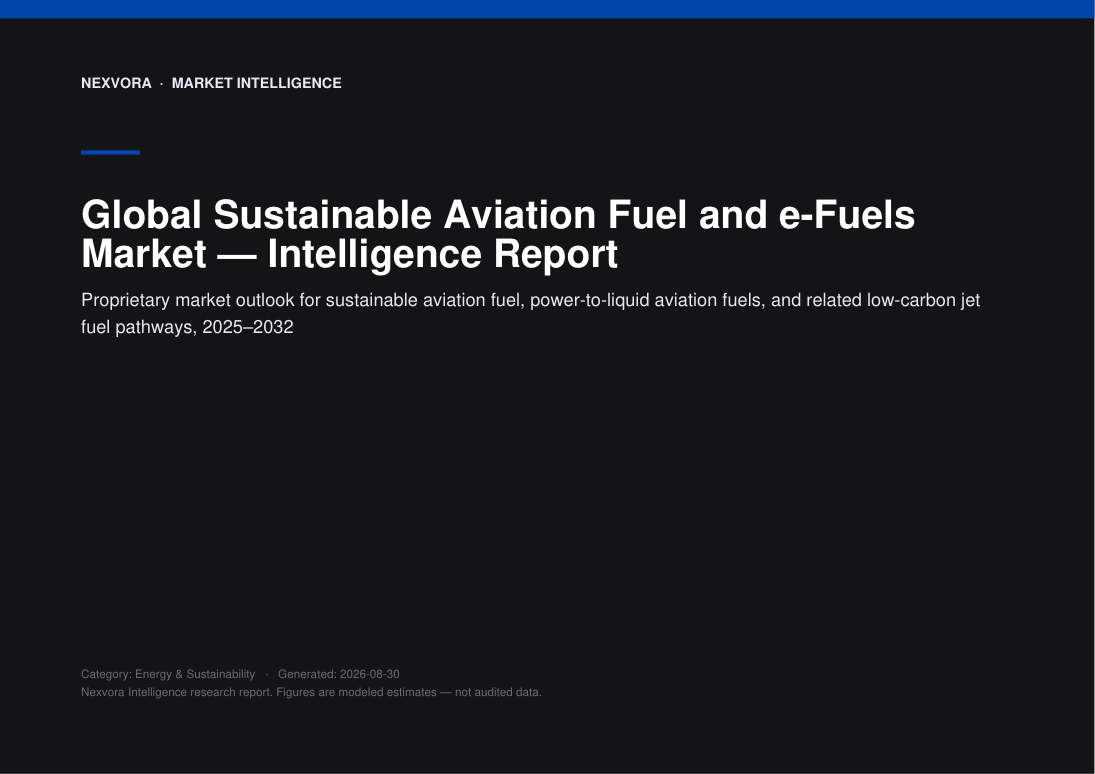
Global Sustainable Aviation Fuel and e-Fuels Market — Intelligence Report
Proprietary market outlook for sustainable aviation fuel, power-to-liquid aviation fuels, and related low-carbon jet fuel pathways, 2025–2032
Nexvora Intelligence market report on Global Sustainable Aviation Fuel and e-Fuels Market — Intelligence Report.
per extra user
Instant access after payment. Secure via Razorpay.
The opening view — free.
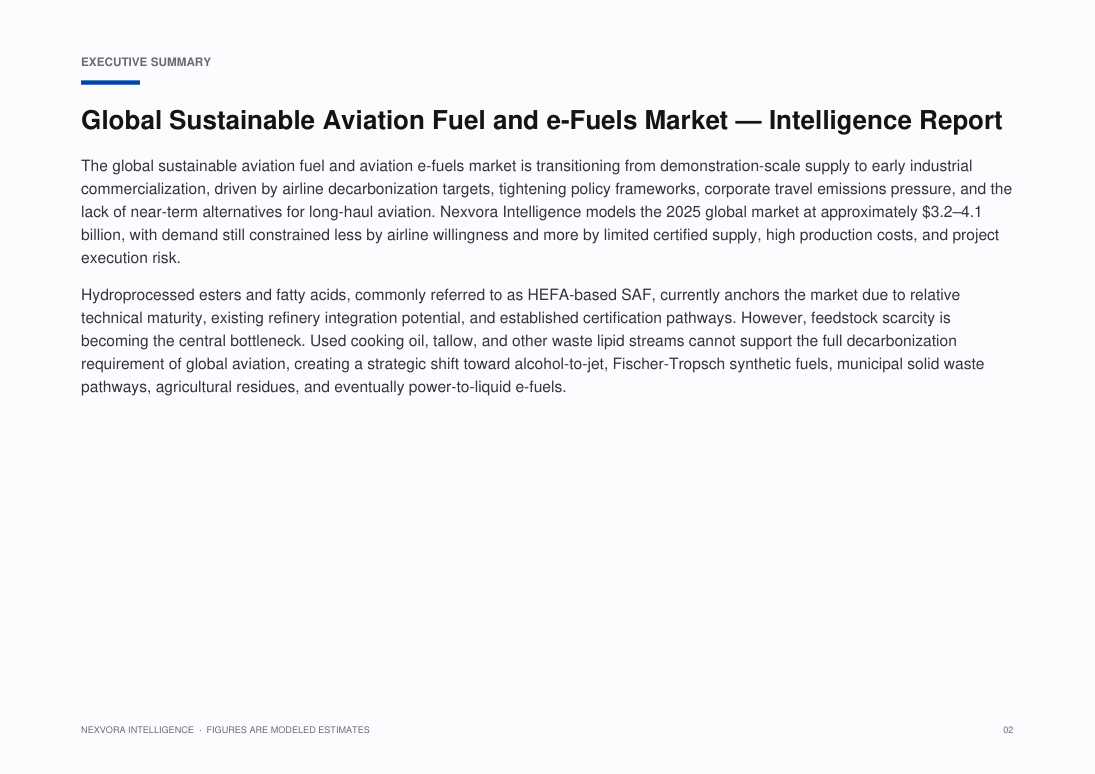
The global sustainable aviation fuel and aviation e-fuels market is transitioning from demonstration-scale supply to early industrial commercialization, driven by airline decarbonization targets, tightening policy frameworks, corporate travel emissions pressure, and the lack of near-term alternatives for long-haul aviation. Nexvora Intelligence models the 2025 global market at approximately $•••–••• billion, with demand still constrained less by airline willingness and more by limited certified supply, high production costs, and project execution risk.
Hydroprocessed esters and fatty acids, commonly referred to as HEFA-based SAF, currently anchors the market due to relative technical maturity, existing refinery integration potential, and established certification pathways. However, feedstock scarcity is becoming the central bottleneck. Used cooking oil, tallow, and other waste lipid streams cannot support the full decarbonization requirement of global aviation, creating a strategic shift toward alcohol-to-jet, Fischer-Tropsch synthetic fuels, municipal solid waste pathways, agricultural residues, and eventually power-to-liquid e-fuels.
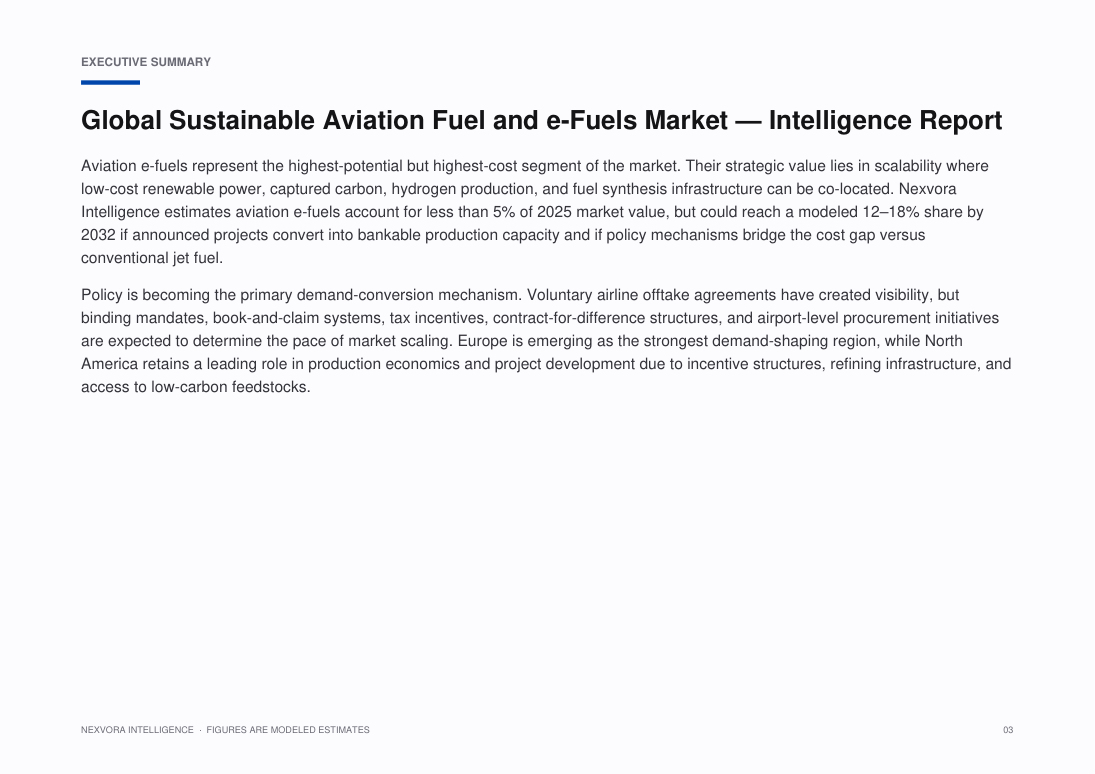
Aviation e-fuels represent the highest-potential but highest-cost segment of the market. Their strategic value lies in scalability where low-cost renewable power, captured carbon, hydrogen production, and fuel synthesis infrastructure can be co-located. Nexvora Intelligence estimates aviation e-fuels account for less than ••% of 2025 market value, but could reach a modeled 12–••% share by 2032 if announced projects convert into bankable production capacity and if policy mechanisms bridge the cost gap versus conventional jet fuel.
Policy is becoming the primary demand-conversion mechanism. Voluntary airline offtake agreements have created visibility, but binding mandates, book-and-claim systems, tax incentives, contract-for-difference structures, and airport-level procurement initiatives are expected to determine the pace of market scaling. Europe is emerging as the strongest demand-shaping region, while North America retains a leading role in production economics and project development due to incentive structures, refining infrastructure, and access to low-carbon feedstocks.
Specific figures are hidden in this free preview. Unlock the report to see all modeled market sizes, forecasts and growth rates.
What this report covers.
Proprietary market outlook for sustainable aviation fuel, power-to-liquid aviation fuels, and related low-carbon jet fuel pathways, 2025–2032
Who this report is for.
- Corporate strategy, planning and M&A teams evaluating the market
- Investors, private equity and venture teams sizing the opportunity
- Product, marketing and go-to-market leaders
- Consultants and analysts building the competitive picture
- Executives planning market entry, expansion or investment
How this report is built.
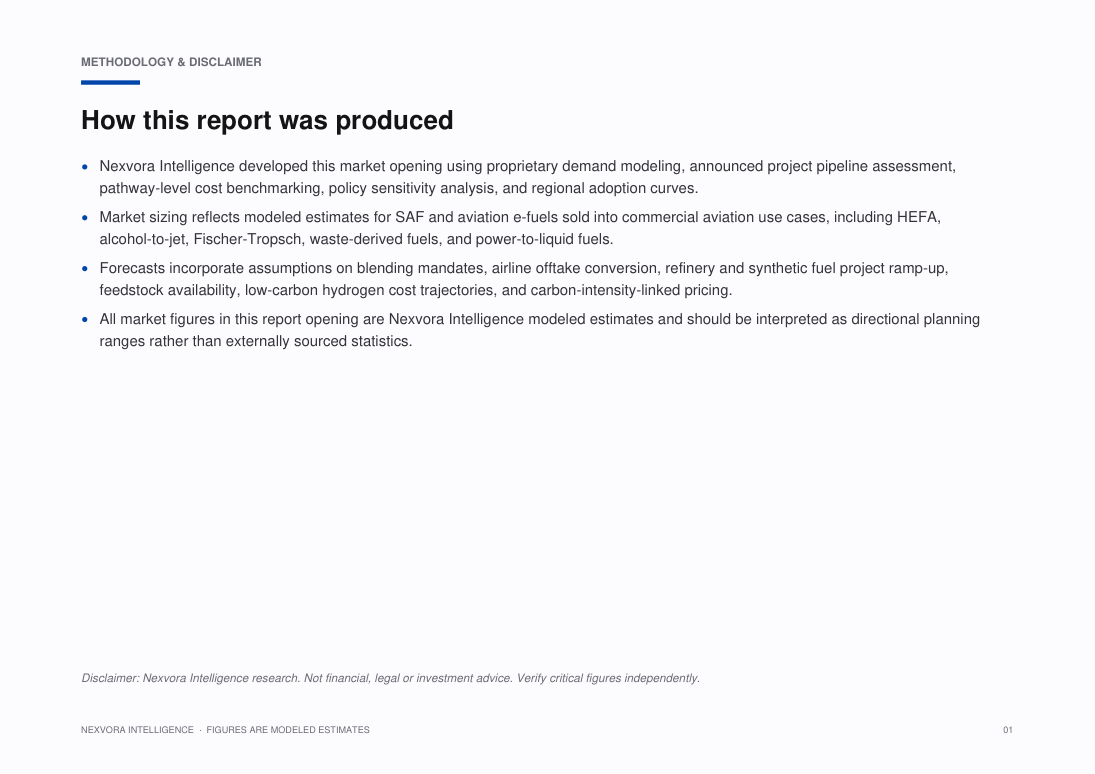
Nexvora Intelligence developed this market opening using proprietary demand modeling, announced project pipeline assessment, pathway-level cost benchmarking, policy sensitivity analysis, and regional adoption curves.
Market sizing reflects modeled estimates for SAF and aviation e-fuels sold into commercial aviation use cases, including HEFA, alcohol-to-jet, Fischer-Tropsch, waste-derived fuels, and power-to-liquid fuels.
Forecasts incorporate assumptions on blending mandates, airline offtake conversion, refinery and synthetic fuel project ramp-up, feedstock availability, low-carbon hydrogen cost trajectories, and carbon-intensity-linked pricing.
All market figures in this report opening are Nexvora Intelligence modeled estimates and should be interpreted as directional planning ranges rather than externally sourced statistics.
What's inside — a number-free look.
A full outline of the figures and tables you'll get. Specific data, market sizes and forecasts are unlocked with purchase.
List of Figures
- Figure 1: Market Overview and Structure — Sustainable Aviation Fuel and e-Fuels
- Figure 2: Market Size and Forecast Framework — Sustainable Aviation Fuel and e-Fuels
- Figure 3: Value Chain and Ecosystem Analysis — Sustainable Aviation Fuel and e-Fuels
- Figure 4: Market Dynamics — Drivers, Restraints and Opportunities — Sustainable Aviation Fuel and e-Fuels
- Figure 5: Segment Contribution Analysis — Sustainable Aviation Fuel and e-Fuels
- Figure 6: Regional Market Landscape — Sustainable Aviation Fuel and e-Fuels
- Figure 7: Country-level Opportunity Mapping — Sustainable Aviation Fuel and e-Fuels
- Figure 8: Competitive Positioning Matrix — Sustainable Aviation Fuel and e-Fuels
- Figure 9: Market Share of Leading Players — Sustainable Aviation Fuel and e-Fuels
- Figure 10: Adoption and Penetration Trends — Sustainable Aviation Fuel and e-Fuels
- Figure 11: Technology and Innovation Landscape — Sustainable Aviation Fuel and e-Fuels
- Figure 12: Pricing and Business Model Analysis — Sustainable Aviation Fuel and e-Fuels
- Figure 13: Investment, Funding and M&A Landscape — Sustainable Aviation Fuel and e-Fuels
- Figure 14: Regulatory and Policy Framework — Sustainable Aviation Fuel and e-Fuels
- Figure 15: Porter's Five Forces Analysis — Sustainable Aviation Fuel and e-Fuels
- Figure 16: PESTLE Analysis — Sustainable Aviation Fuel and e-Fuels
- Figure 17: Growth Opportunity Heat Map — Sustainable Aviation Fuel and e-Fuels
- Figure 18: Future Outlook and Strategic Roadmap — Sustainable Aviation Fuel and e-Fuels
List of Tables
- Table 1: Market Segmentation Overview — Sustainable Aviation Fuel and e-Fuels
- Table 2: Segment Definitions and Scope — Sustainable Aviation Fuel and e-Fuels
- Table 3: Regional and Country Coverage Summary — Sustainable Aviation Fuel and e-Fuels
- Table 4: Key Company Profiles and Offerings — Sustainable Aviation Fuel and e-Fuels
- Table 5: Competitive Benchmarking Matrix — Sustainable Aviation Fuel and e-Fuels
- Table 6: Product and Service Portfolio Mapping — Sustainable Aviation Fuel and e-Fuels
- Table 7: Market Drivers, Restraints and Trends — Sustainable Aviation Fuel and e-Fuels
- Table 8: Strategic Initiatives and Developments — Sustainable Aviation Fuel and e-Fuels
- Table 9: Partnerships and Collaborations — Sustainable Aviation Fuel and e-Fuels
- Table 10: Research Assumptions and Limitations — Sustainable Aviation Fuel and e-Fuels
- Table 11: Data Sources and References — Sustainable Aviation Fuel and e-Fuels
- Table 12: Report Scope and Coverage Summary — Sustainable Aviation Fuel and e-Fuels
A look at the pages.
107 pages · 20 sections · charts & tables
A genuine peek at the opening pages. Unlock to read every page in full.
6 of 107 pages shown
Turn this market into a plan for your business.
Answer a few quick questions and unlock a personalised operational read — your maturity score, prioritised focus areas and quick wins — mapped to where this market is heading. Result delivered instantly and emailed to you.
- Maturity score & prioritised focus areas
- Practical quick wins and a recommended next step
Questions, answered.
How big is the Global Sustainable Aviation Fuel and e-Fuels Market?
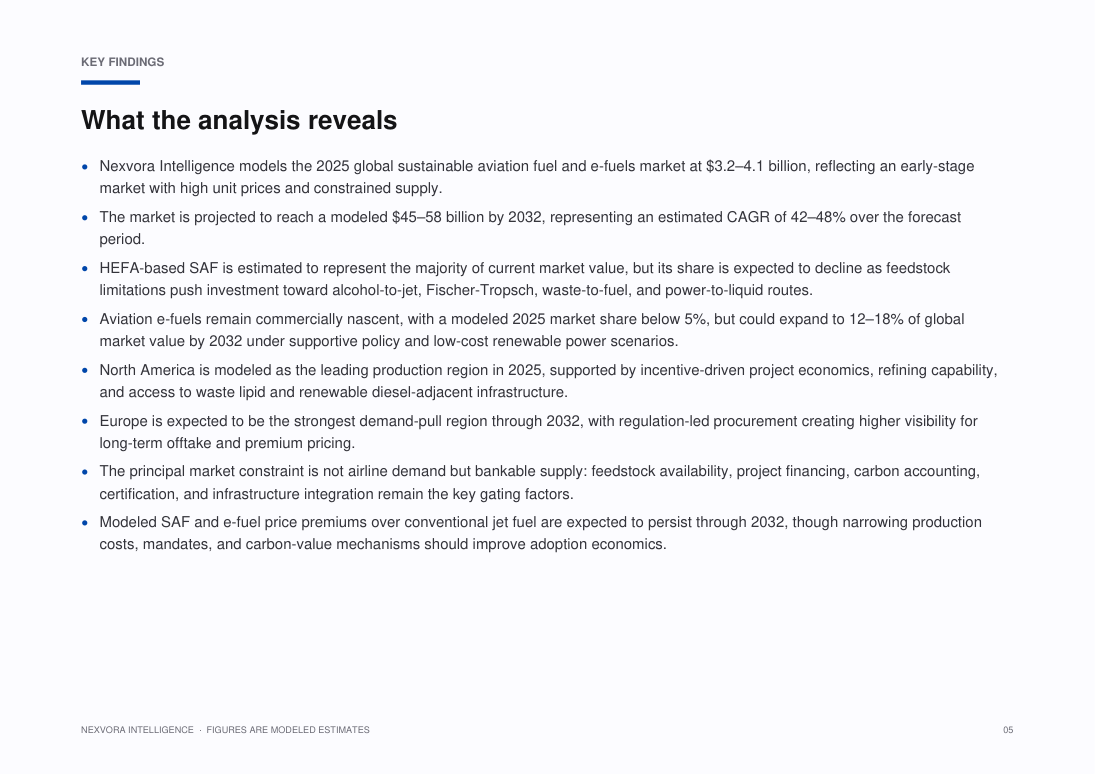
Nexvora models the Global Sustainable Aviation Fuel and e-Fuels Market at approximately $3.2–4.1 billion, 2025E. Full market sizing, segmentation and forecasts are inside the report (modeled estimate).
What is the growth rate (CAGR) of the Global Sustainable Aviation Fuel and e-Fuels Market?
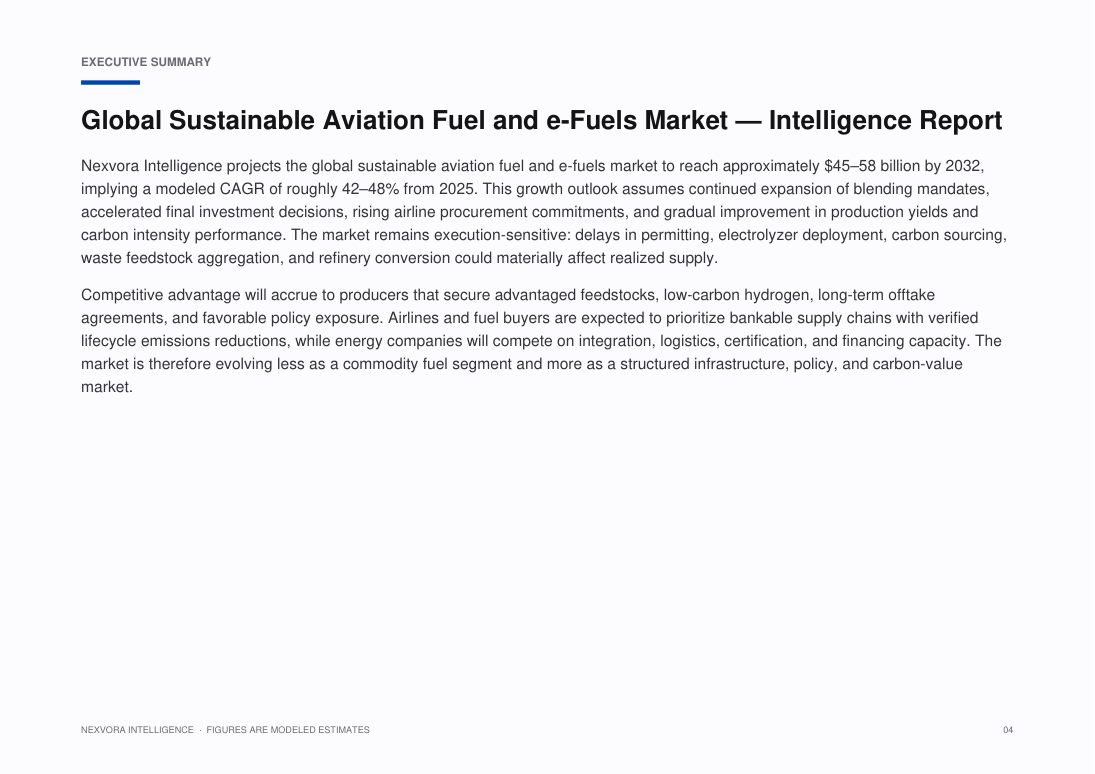
The Global Sustainable Aviation Fuel and e-Fuels Market is projected to grow at a CAGR of about 42–48%, 2025–2032 over the forecast period — a Nexvora modeled estimate detailed across the report's 20 sections.
What does this report include?
A complete market intelligence report — market sizing and forecasts, segmentation, regional and industry analysis, competitive landscape, trends, and strategic recommendations across 20 sections.
How do I access it after purchase?
Instantly, in your secure online viewer. Reports are view-only and available on any device from your library.
Are the figures sourced?
Quantitative figures are Nexvora modeled estimates unless explicitly cited to a referenced source within the report.
Can I buy access for my team?
Yes — add user seats at checkout, or subscribe for bulk access across multiple reports.
Nexvora Intelligence research report. All quantitative figures are modeled estimates — not audited data. Not financial or investment advice.
More market reports
Keep exploring intelligence in this and related sectors.

Global Data Center Power & Liquid Cooling Infrastructure Market — Accelerated Compute, Grid Constraints & Thermal Management Outlook
Beyond the Grid: Space-Based Solar Power — Strategic Intelligence Report

Global Direct Air Capture, Durable Carbon Removal Offtakes and MRV Infrastructure Market — Intelligence Report