
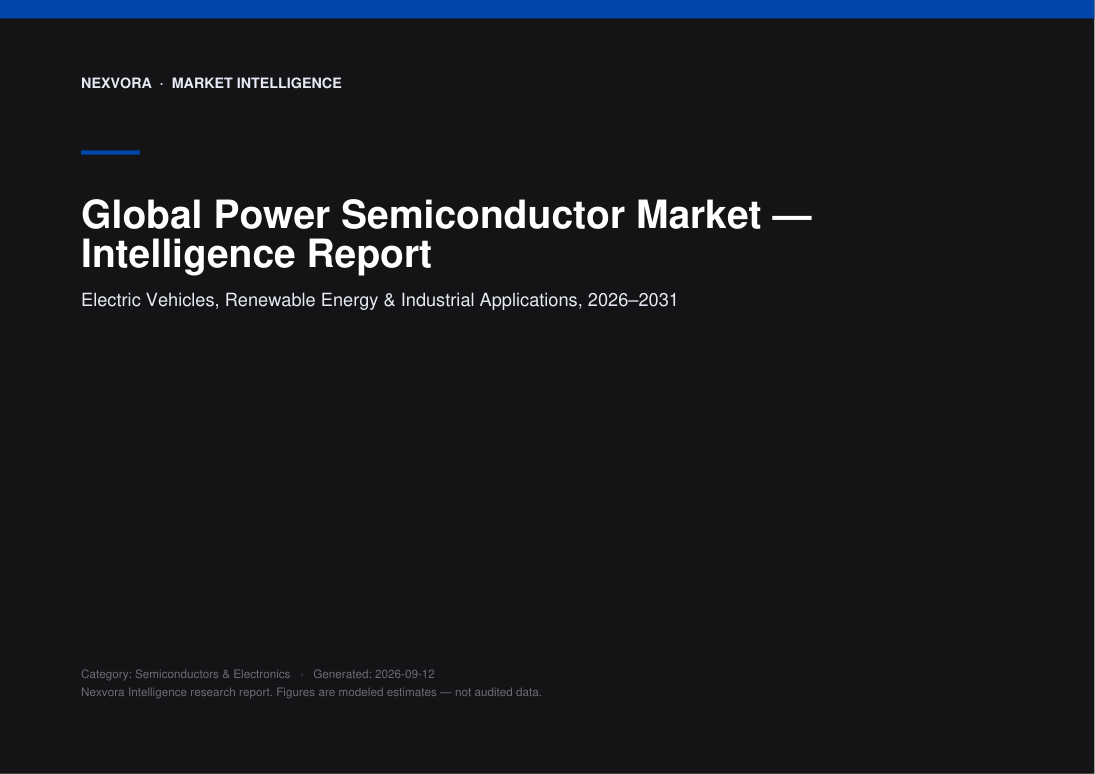
Global Power Semiconductor Market — Intelligence Report
Electric Vehicles, Renewable Energy & Industrial Applications, 2026–2031
Nexvora Intelligence market report on Global Power Semiconductor Market: Electric Vehicles, Renewable Energy & Industrial Applications, 2026–2031.
per extra user
Instant access after payment. Secure via Razorpay.
The opening view — free.
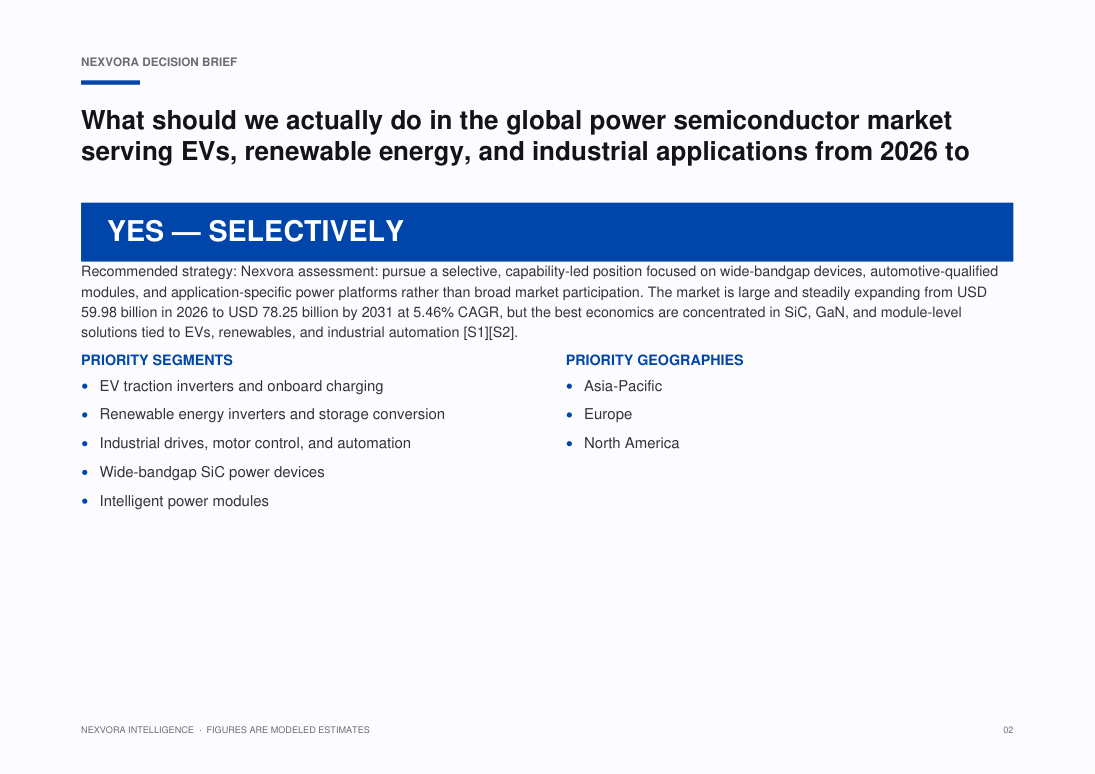
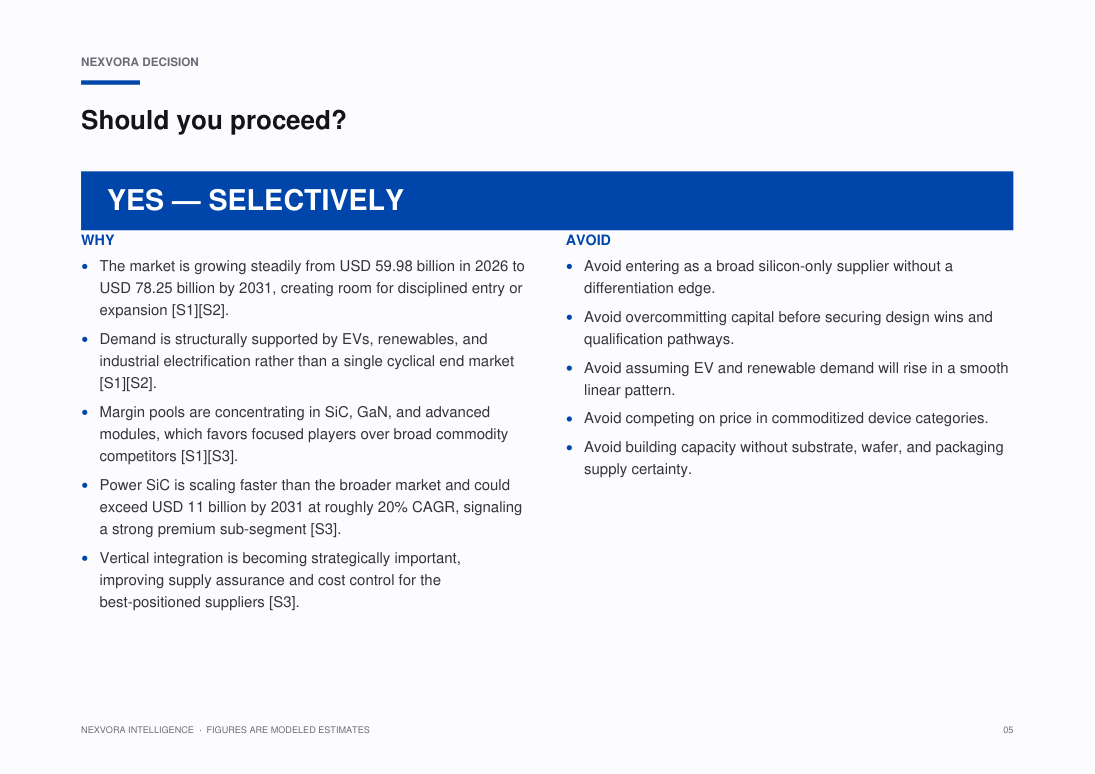
The global power semiconductor market enters the 2026–2031 period on a stable expansion path, supported by structural demand for efficient power conversion across electric vehicles, renewable energy systems, industrial automation, and other high-load electronics applications. The market was valued at USD ••• billion in 2025 and is expected to reach USD ••• billion by 2031, reflecting a CAGR of ••% over the forecast period [S1][S2].
Demand composition is increasingly shaped by electrification and efficiency requirements rather than pure unit growth. Automotive remains the most important growth engine, while industrial and energy applications provide a broad, cyclical buffer that reduces dependence on any single end market. This diversification supports resilient revenue expansion even when broader semiconductor spending softens.
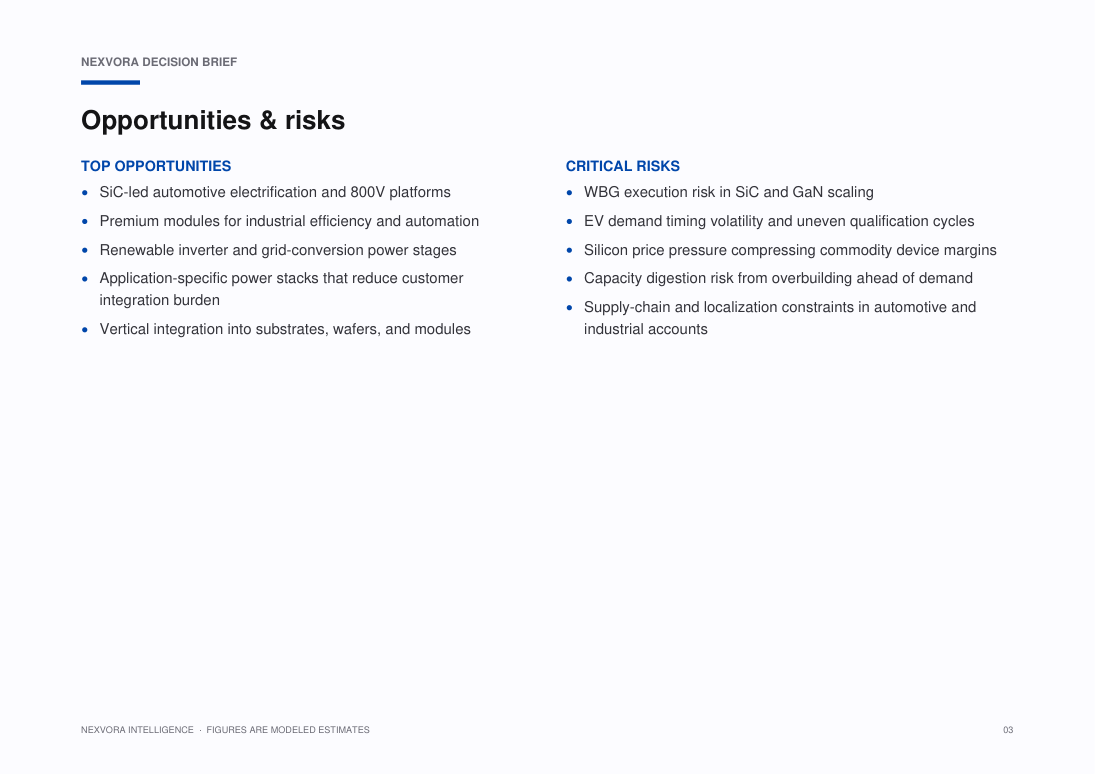
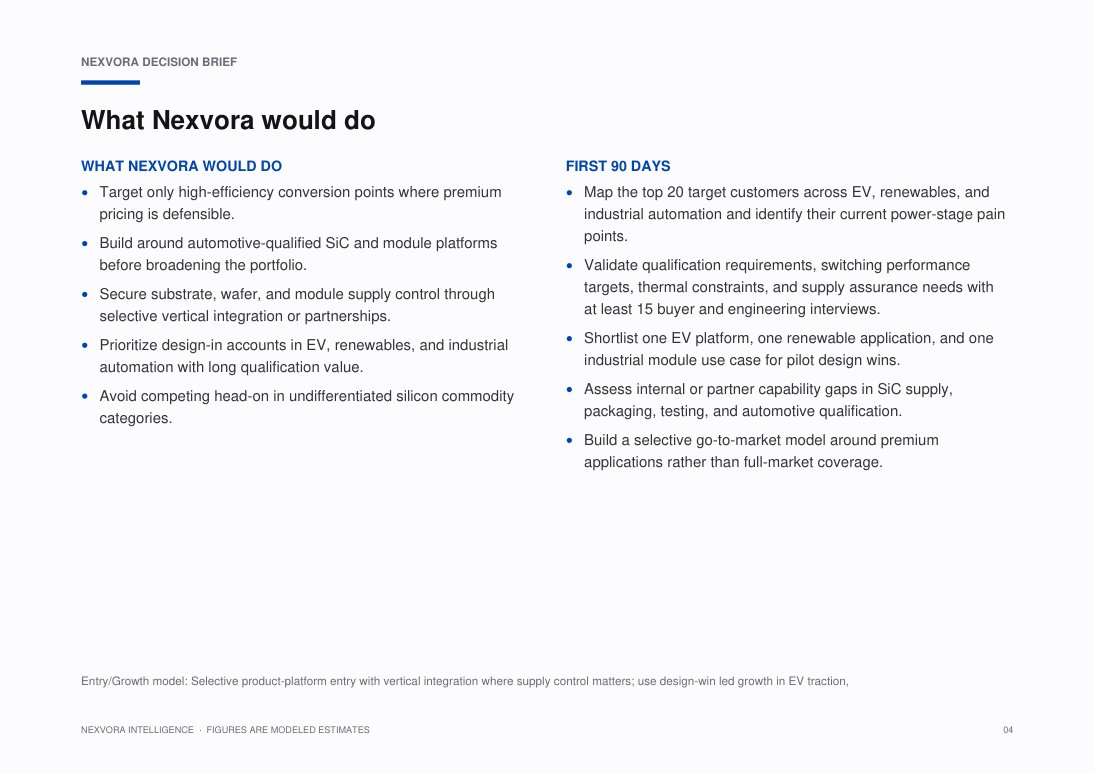
Technology leadership is shifting toward wide-bandgap materials, particularly silicon carbide and gallium nitride, which command premium pricing because they outperform silicon in high-voltage and high-efficiency use cases [S1]. Within this mix, SiC is gaining the clearest structural advantage in electric-vehicle powertrains and charging infrastructure, while GaN is expanding in compact, high-frequency power delivery applications.
The market is also becoming more vertically integrated. Leading suppliers are investing in wafer capacity, module integration, and selective sourcing to protect margins and secure supply in a tightening technology stack. This is most visible in SiC, where the ability to control substrate access and downstream packaging increasingly determines competitive position [S3].
Specific figures are hidden in this free preview. Unlock the report to see all modeled market sizes, forecasts and growth rates.
What this report covers.
Electric Vehicles, Renewable Energy & Industrial Applications, 2026–2031
Who this report is for.
- Corporate strategy, planning and M&A teams evaluating the market
- Investors, private equity and venture teams sizing the opportunity
- Product, marketing and go-to-market leaders
- Consultants and analysts building the competitive picture
- Executives planning market entry, expansion or investment
How this report is built.
Nexvora Intelligence integrates provided market evidence with structured sector analysis to frame the opening view of the market, emphasizing demand drivers, technology shifts, competitive structure, and segment-level momentum.
Sourced market figures are used only where explicitly supported by the evidence set; all other market sizing language is presented as modeled estimate or qualitative assessment.
Where the evidence indicates divergent market views or narrower subsegment growth rates, Nexvora treats these as segment-specific dynamics rather than directly extrapolating them to the full market.
This opening section is designed as a board-level briefing layer: concise on numbers, explicit on assumptions, and focused on the commercial implications of electrification, renewable integration, and industrial power efficiency.
What's inside — a number-free look.
A full outline of the figures and tables you'll get. Specific data, market sizes and forecasts are unlocked with purchase.
List of Figures
- Figure 1: Market Overview and Structure — Power Semiconductor
- Figure 2: Market Size and Forecast Framework — Power Semiconductor
- Figure 3: Value Chain and Ecosystem Analysis — Power Semiconductor
- Figure 4: Market Dynamics — Drivers, Restraints and Opportunities — Power Semiconductor
- Figure 5: Segment Contribution Analysis — Power Semiconductor
- Figure 6: Regional Market Landscape — Power Semiconductor
- Figure 7: Country-level Opportunity Mapping — Power Semiconductor
- Figure 8: Competitive Positioning Matrix — Power Semiconductor
- Figure 9: Market Share of Leading Players — Power Semiconductor
- Figure 10: Adoption and Penetration Trends — Power Semiconductor
- Figure 11: Technology and Innovation Landscape — Power Semiconductor
- Figure 12: Pricing and Business Model Analysis — Power Semiconductor
- Figure 13: Investment, Funding and M&A Landscape — Power Semiconductor
- Figure 14: Regulatory and Policy Framework — Power Semiconductor
- Figure 15: Porter's Five Forces Analysis — Power Semiconductor
- Figure 16: PESTLE Analysis — Power Semiconductor
- Figure 17: Growth Opportunity Heat Map — Power Semiconductor
- Figure 18: Future Outlook and Strategic Roadmap — Power Semiconductor
List of Tables
- Table 1: Market Segmentation Overview — Power Semiconductor
- Table 2: Segment Definitions and Scope — Power Semiconductor
- Table 3: Regional and Country Coverage Summary — Power Semiconductor
- Table 4: Key Company Profiles and Offerings — Power Semiconductor
- Table 5: Competitive Benchmarking Matrix — Power Semiconductor
- Table 6: Product and Service Portfolio Mapping — Power Semiconductor
- Table 7: Market Drivers, Restraints and Trends — Power Semiconductor
- Table 8: Strategic Initiatives and Developments — Power Semiconductor
- Table 9: Partnerships and Collaborations — Power Semiconductor
- Table 10: Research Assumptions and Limitations — Power Semiconductor
- Table 11: Data Sources and References — Power Semiconductor
- Table 12: Report Scope and Coverage Summary — Power Semiconductor
A look at the pages.
124 pages · 20 sections · charts & tables
A genuine peek at the opening pages. Unlock to read every page in full.
6 of 124 pages shown
Turn this market into a plan for your business.
Answer a few quick questions and unlock a personalised operational read — your maturity score, prioritised focus areas and quick wins — mapped to where this market is heading. Result delivered instantly and emailed to you.
- Maturity score & prioritised focus areas
- Practical quick wins and a recommended next step
Questions, answered.
How big is the Global Power Semiconductor Market?
Nexvora models the Global Power Semiconductor Market at approximately USD 59.98 billion (2026). Full market sizing, segmentation and forecasts are inside the report (modeled estimate).
What is the growth rate (CAGR) of the Global Power Semiconductor Market?
The Global Power Semiconductor Market is projected to grow at a CAGR of about 5.46% (2026–2031) over the forecast period — a Nexvora modeled estimate detailed across the report's 20 sections.
What does this report include?
A complete market intelligence report — market sizing and forecasts, segmentation, regional and industry analysis, competitive landscape, trends, and strategic recommendations across 20 sections.
How do I access it after purchase?
Instantly, in your secure online viewer. Reports are view-only and available on any device from your library.
Are the figures sourced?
Quantitative figures are Nexvora modeled estimates unless explicitly cited to a referenced source within the report.
Can I buy access for my team?
Yes — add user seats at checkout, or subscribe for bulk access across multiple reports.
Nexvora Intelligence research report. All quantitative figures are modeled estimates — not audited data. Not financial or investment advice.
More market reports
Keep exploring intelligence in this and related sectors.
India Semiconductor Market — Chip Manufacturing, Electronics Ecosystem & Investment Outlook

Global AI Semiconductor Market — Intelligence Report
Europe Semiconductor Market — Automotive Chips, Industrial Electronics & Strategic Manufacturing Outlook