
Global Non-Opioid Pain Therapeutics & Nav1.8 Inhibitors Market — Intelligence Report
Proprietary market outlook and competitive intelligence, 2026–2033
Nexvora Intelligence market report on Global Non-Opioid Pain Therapeutics & Nav1.8 Inhibitors Market.

per extra user
Instant access after payment. Secure via Razorpay.
The opening view — free.
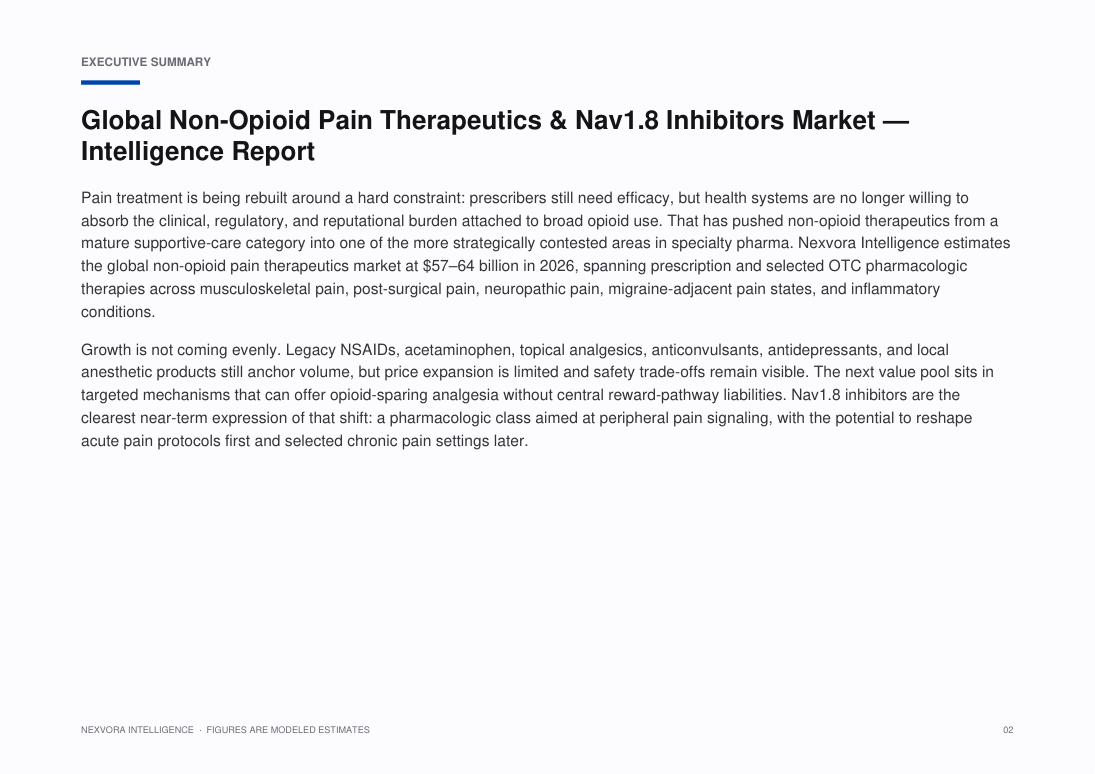
Pain treatment is being rebuilt around a hard constraint: prescribers still need efficacy, but health systems are no longer willing to absorb the clinical, regulatory, and reputational burden attached to broad opioid use. That has pushed non-opioid therapeutics from a mature supportive-care category into one of the more strategically contested areas in specialty pharma. Nexvora Intelligence estimates the global non-opioid pain therapeutics market at $•••–••• billion in 2026, spanning prescription and selected OTC pharmacologic therapies across musculoskeletal pain, post-surgical pain, neuropathic pain, migraine-adjacent pain states, and inflammatory conditions.
Growth is not coming evenly. Legacy NSAIDs, acetaminophen, topical analgesics, anticonvulsants, antidepressants, and local anesthetic products still anchor volume, but price expansion is limited and safety trade-offs remain visible. The next value pool sits in targeted mechanisms that can offer opioid-sparing analgesia without central reward-pathway liabilities. Nav1.8 inhibitors are the clearest near-term expression of that shift: a pharmacologic class aimed at peripheral pain signaling, with the potential to reshape acute pain protocols first and selected chronic pain settings later.
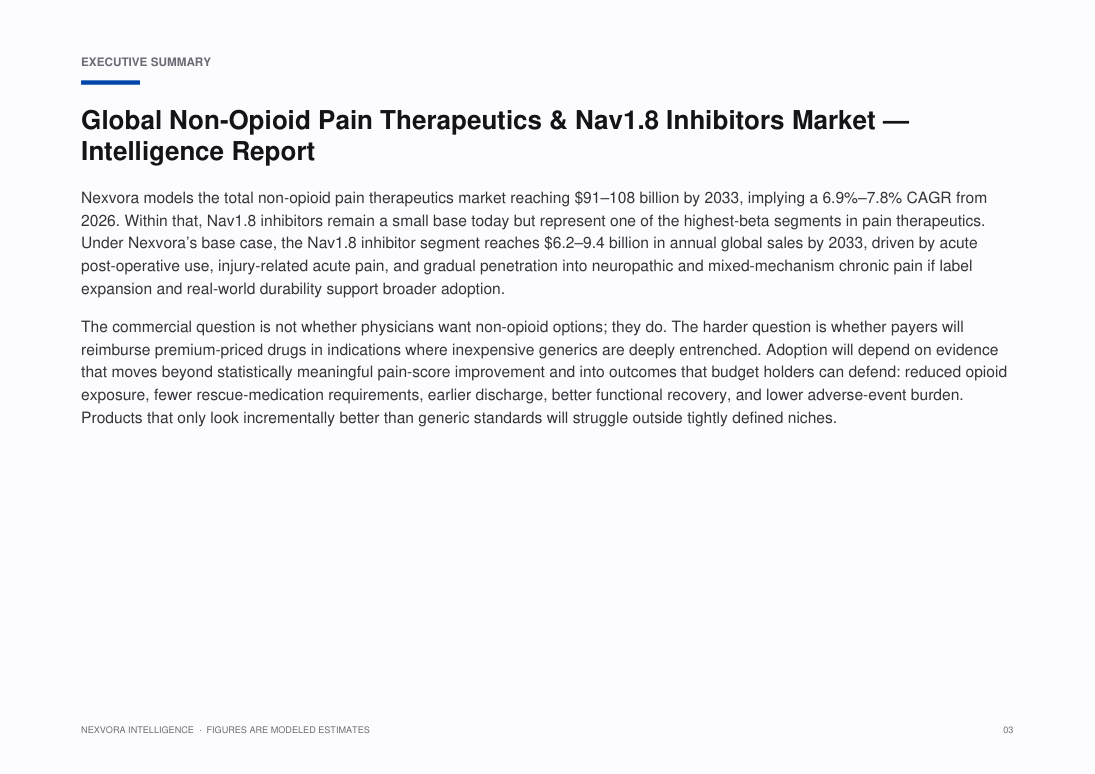
Nexvora models the total non-opioid pain therapeutics market reaching $•••–••• billion by 2033, implying a ••%–••% CAGR from 2026. Within that, Nav1.8 inhibitors remain a small base today but represent one of the highest-beta segments in pain therapeutics. Under Nexvora’s base case, the Nav1.8 inhibitor segment reaches $•••–••• billion in annual global sales by 2033, driven by acute post-operative use, injury-related acute pain, and gradual penetration into neuropathic and mixed-mechanism chronic pain if label expansion and real-world durability support broader adoption.
The commercial question is not whether physicians want non-opioid options; they do. The harder question is whether payers will reimburse premium-priced drugs in indications where inexpensive generics are deeply entrenched. Adoption will depend on evidence that moves beyond statistically meaningful pain-score improvement and into outcomes that budget holders can defend: reduced opioid exposure, fewer rescue-medication requirements, earlier discharge, better functional recovery, and lower adverse-event burden. Products that only look incrementally better than generic standards will struggle outside tightly defined niches.
Specific figures are hidden in this free preview. Unlock the report to see all modeled market sizes, forecasts and growth rates.
What this report covers.
Proprietary market outlook and competitive intelligence, 2026–2033
Who this report is for.
- Corporate strategy, planning and M&A teams evaluating the market
- Investors, private equity and venture teams sizing the opportunity
- Product, marketing and go-to-market leaders
- Consultants and analysts building the competitive picture
- Executives planning market entry, expansion or investment
How this report is built.
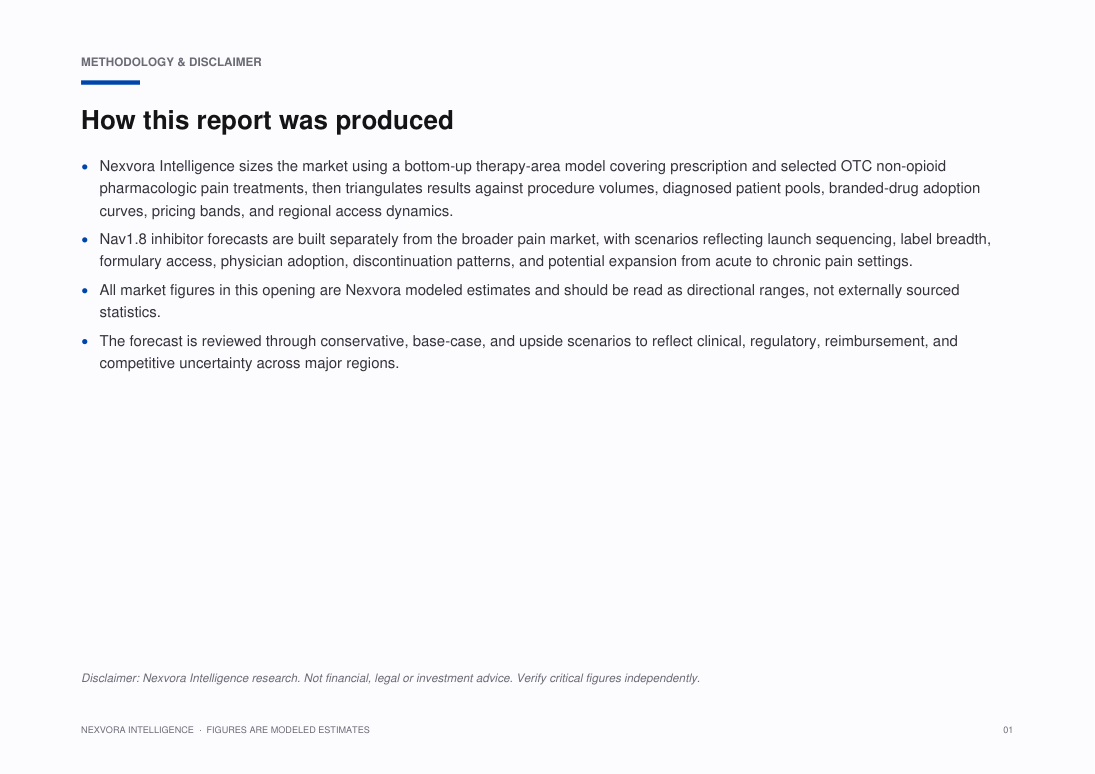
Nexvora Intelligence sizes the market using a bottom-up therapy-area model covering prescription and selected OTC non-opioid pharmacologic pain treatments, then triangulates results against procedure volumes, diagnosed patient pools, branded-drug adoption curves, pricing bands, and regional access dynamics.
Nav1.8 inhibitor forecasts are built separately from the broader pain market, with scenarios reflecting launch sequencing, label breadth, formulary access, physician adoption, discontinuation patterns, and potential expansion from acute to chronic pain settings.
All market figures in this opening are Nexvora modeled estimates and should be read as directional ranges, not externally sourced statistics.
The forecast is reviewed through conservative, base-case, and upside scenarios to reflect clinical, regulatory, reimbursement, and competitive uncertainty across major regions.
What's inside — a number-free look.
A full outline of the figures and tables you'll get. Specific data, market sizes and forecasts are unlocked with purchase.
List of Figures
- Figure 1: Market Overview and Structure — Non-Opioid Pain Therapeutics & Nav1.8 Inhibitors
- Figure 2: Market Size and Forecast Framework — Non-Opioid Pain Therapeutics & Nav1.8 Inhibitors
- Figure 3: Value Chain and Ecosystem Analysis — Non-Opioid Pain Therapeutics & Nav1.8 Inhibitors
- Figure 4: Market Dynamics — Drivers, Restraints and Opportunities — Non-Opioid Pain Therapeutics & Nav1.8 Inhibitors
- Figure 5: Segment Contribution Analysis — Non-Opioid Pain Therapeutics & Nav1.8 Inhibitors
- Figure 6: Regional Market Landscape — Non-Opioid Pain Therapeutics & Nav1.8 Inhibitors
- Figure 7: Country-level Opportunity Mapping — Non-Opioid Pain Therapeutics & Nav1.8 Inhibitors
- Figure 8: Competitive Positioning Matrix — Non-Opioid Pain Therapeutics & Nav1.8 Inhibitors
- Figure 9: Market Share of Leading Players — Non-Opioid Pain Therapeutics & Nav1.8 Inhibitors
- Figure 10: Adoption and Penetration Trends — Non-Opioid Pain Therapeutics & Nav1.8 Inhibitors
- Figure 11: Technology and Innovation Landscape — Non-Opioid Pain Therapeutics & Nav1.8 Inhibitors
- Figure 12: Pricing and Business Model Analysis — Non-Opioid Pain Therapeutics & Nav1.8 Inhibitors
- Figure 13: Investment, Funding and M&A Landscape — Non-Opioid Pain Therapeutics & Nav1.8 Inhibitors
- Figure 14: Regulatory and Policy Framework — Non-Opioid Pain Therapeutics & Nav1.8 Inhibitors
- Figure 15: Porter's Five Forces Analysis — Non-Opioid Pain Therapeutics & Nav1.8 Inhibitors
- Figure 16: PESTLE Analysis — Non-Opioid Pain Therapeutics & Nav1.8 Inhibitors
- Figure 17: Growth Opportunity Heat Map — Non-Opioid Pain Therapeutics & Nav1.8 Inhibitors
- Figure 18: Future Outlook and Strategic Roadmap — Non-Opioid Pain Therapeutics & Nav1.8 Inhibitors
List of Tables
- Table 1: Market Segmentation Overview — Non-Opioid Pain Therapeutics & Nav1.8 Inhibitors
- Table 2: Segment Definitions and Scope — Non-Opioid Pain Therapeutics & Nav1.8 Inhibitors
- Table 3: Regional and Country Coverage Summary — Non-Opioid Pain Therapeutics & Nav1.8 Inhibitors
- Table 4: Key Company Profiles and Offerings — Non-Opioid Pain Therapeutics & Nav1.8 Inhibitors
- Table 5: Competitive Benchmarking Matrix — Non-Opioid Pain Therapeutics & Nav1.8 Inhibitors
- Table 6: Product and Service Portfolio Mapping — Non-Opioid Pain Therapeutics & Nav1.8 Inhibitors
- Table 7: Market Drivers, Restraints and Trends — Non-Opioid Pain Therapeutics & Nav1.8 Inhibitors
- Table 8: Strategic Initiatives and Developments — Non-Opioid Pain Therapeutics & Nav1.8 Inhibitors
- Table 9: Partnerships and Collaborations — Non-Opioid Pain Therapeutics & Nav1.8 Inhibitors
- Table 10: Research Assumptions and Limitations — Non-Opioid Pain Therapeutics & Nav1.8 Inhibitors
- Table 11: Data Sources and References — Non-Opioid Pain Therapeutics & Nav1.8 Inhibitors
- Table 12: Report Scope and Coverage Summary — Non-Opioid Pain Therapeutics & Nav1.8 Inhibitors
A look at the pages.
107 pages · 20 sections · charts & tables
A genuine peek at the opening pages. Unlock to read every page in full.
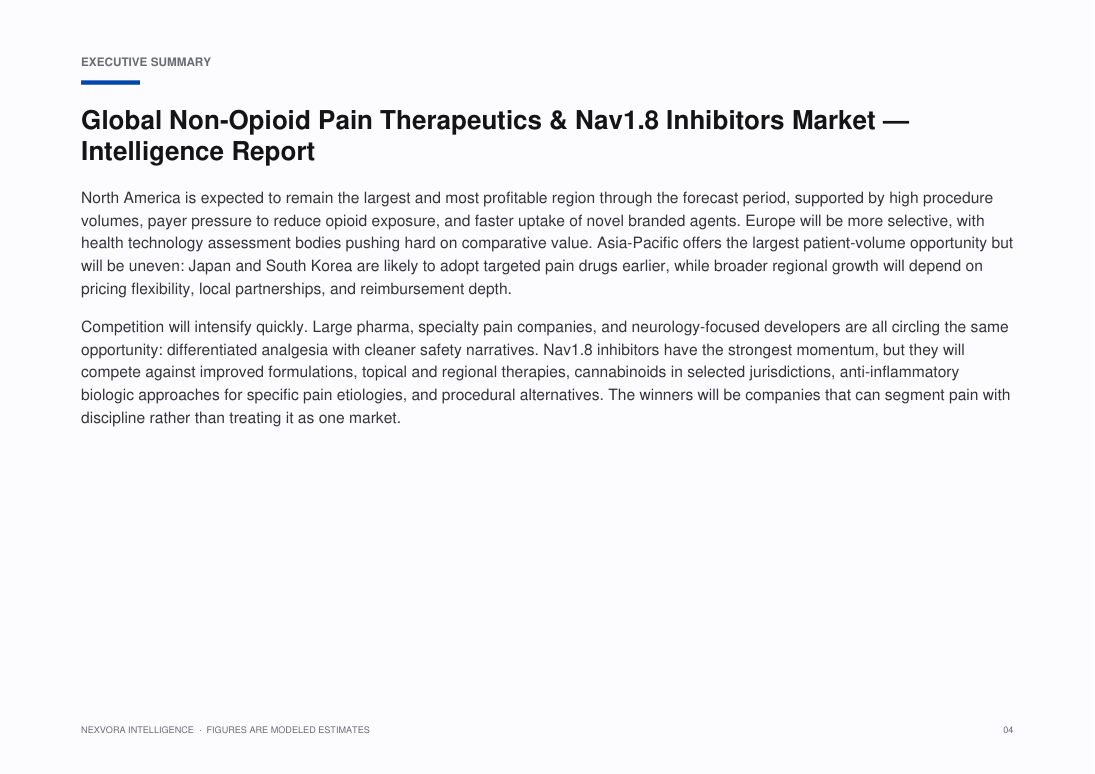
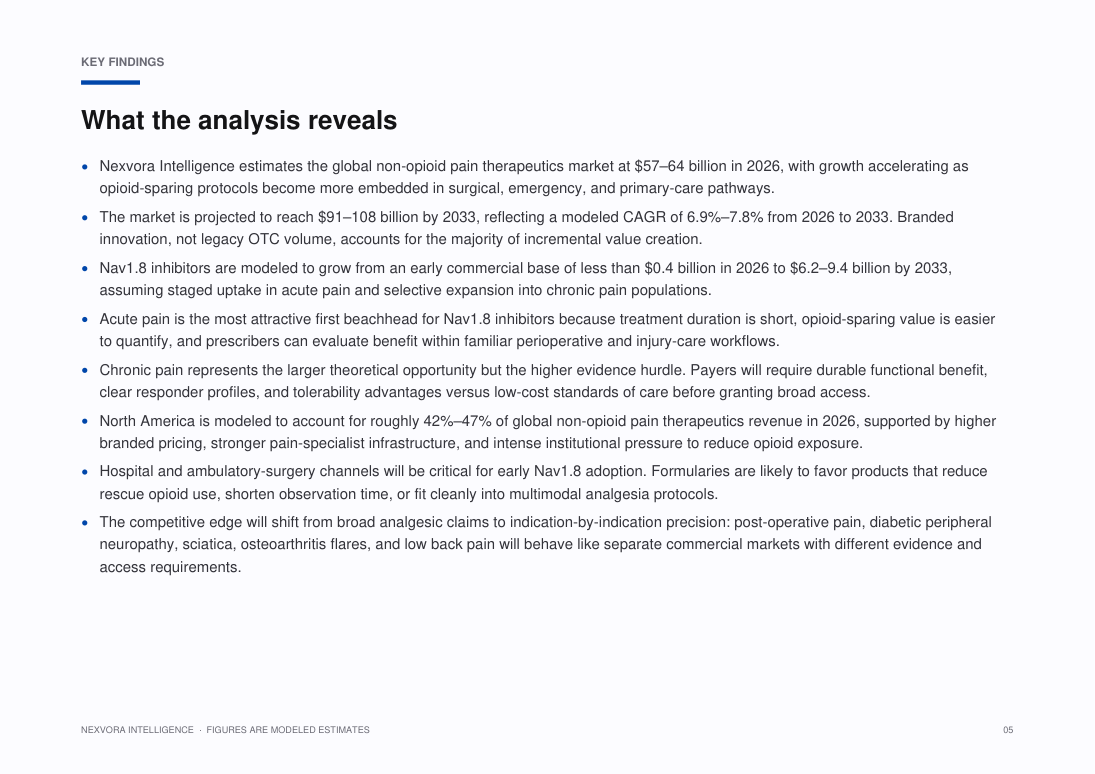
6 of 107 pages shown
Turn this market into a plan for your business.
Answer a few quick questions and unlock a personalised operational read — your maturity score, prioritised focus areas and quick wins — mapped to where this market is heading. Result delivered instantly and emailed to you.
- Maturity score & prioritised focus areas
- Practical quick wins and a recommended next step
Questions, answered.
How big is the Global Non-Opioid Pain Therapeutics & Nav1.8 Inhibitors Market?
Nexvora models the Global Non-Opioid Pain Therapeutics & Nav1.8 Inhibitors Market at approximately $57–64B, 2026E. Full market sizing, segmentation and forecasts are inside the report (modeled estimate).
What is the growth rate (CAGR) of the Global Non-Opioid Pain Therapeutics & Nav1.8 Inhibitors Market?
The Global Non-Opioid Pain Therapeutics & Nav1.8 Inhibitors Market is projected to grow at a CAGR of about 6.9%–7.8%, 2026–2033 over the forecast period — a Nexvora modeled estimate detailed across the report's 20 sections.
What does this report include?
A complete market intelligence report — market sizing and forecasts, segmentation, regional and industry analysis, competitive landscape, trends, and strategic recommendations across 20 sections.
How do I access it after purchase?
Instantly, in your secure online viewer. Reports are view-only and available on any device from your library.
Are the figures sourced?
Quantitative figures are Nexvora modeled estimates unless explicitly cited to a referenced source within the report.
Can I buy access for my team?
Yes — add user seats at checkout, or subscribe for bulk access across multiple reports.
Nexvora Intelligence research report. All quantitative figures are modeled estimates — not audited data. Not financial or investment advice.
Clinical Trial Management Software vs Pharmaceutical Contract Manufacturing
The right choice depends on the buyer’s priorities because these offerings serve different healthcare and life sciences needs. Choose Lonza’s Pharmaceutical Contract Manufacturing if you need pharmaceutical contract development and manufacturing services for biologics, small molecules, or selected advanced therapy manufacturing. Choose Oracle’s Clinical Trial Management Software if your priority is software for clinical trial operations.
Grounded in published specifications — guidance, not an endorsement.
More market reports
Keep exploring intelligence in this and related sectors.

Global Radiopharmaceutical Theranostics & Actinium-225 Supply Chain Market — Intelligence Report

Global Computational Drug Discovery Platforms & Biomedical Foundation Models Market — Intelligence Report
Global Oral GLP-1 & Next-Generation Obesity Therapeutics Market — Intelligence Report
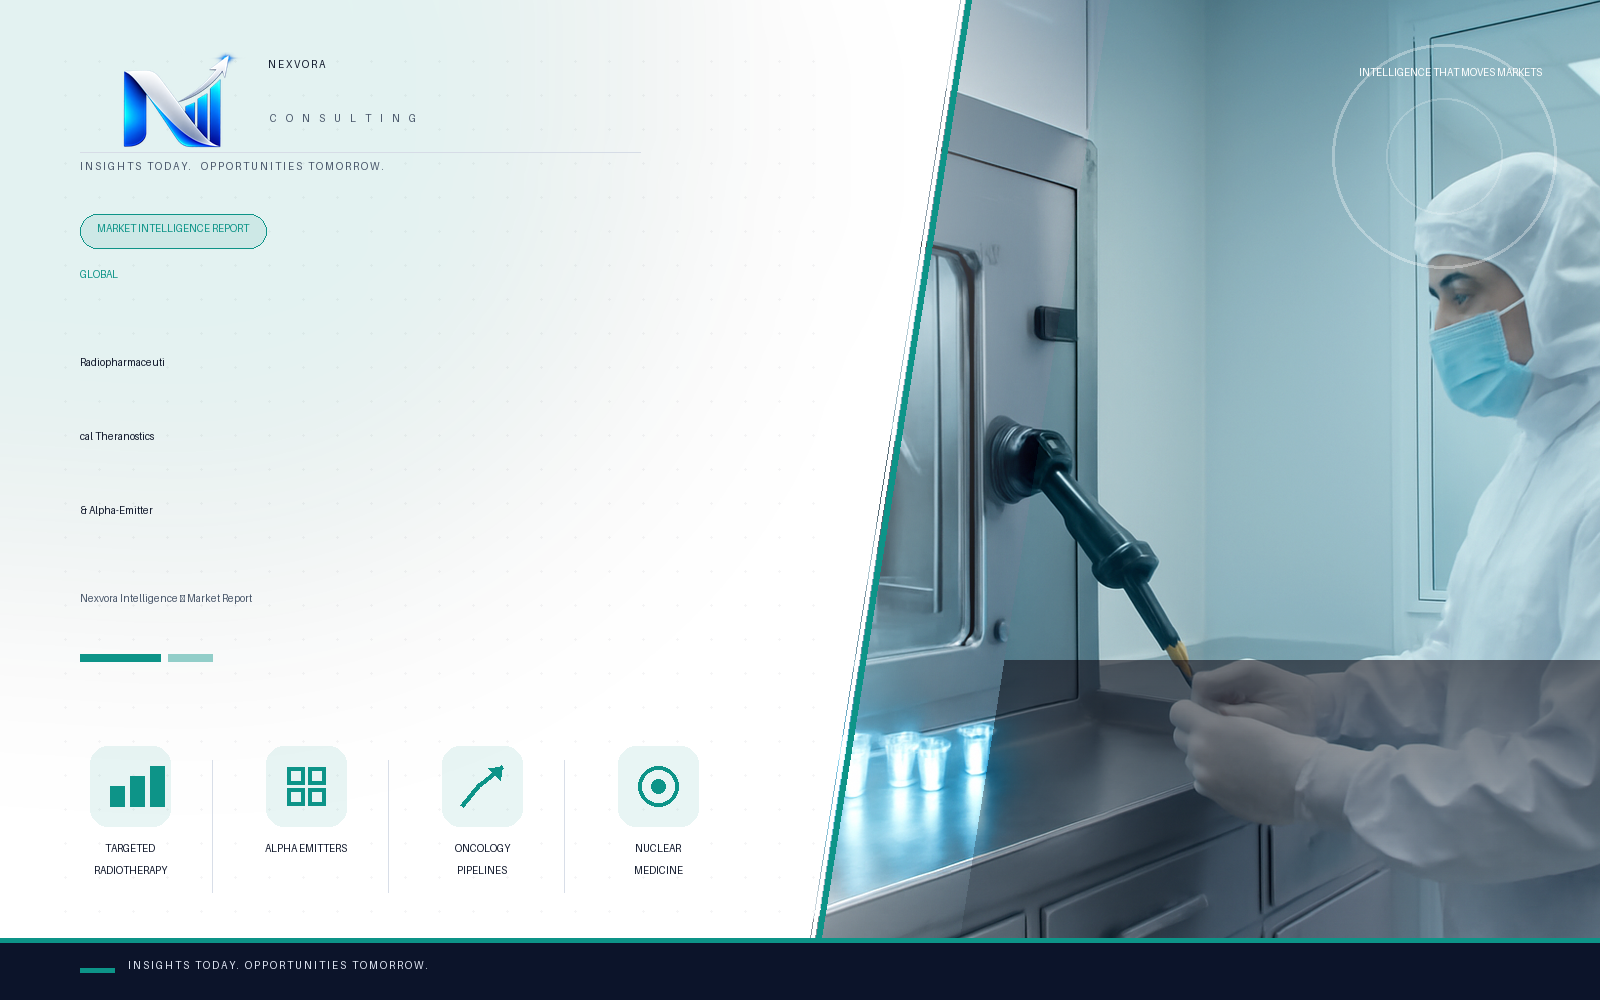
Global Radiopharmaceutical Theranostics & Alpha-Emitter Oncology Market — Intelligence Report
AI Analyst
Insights and answers generated live from Global Non-Opioid Pain Therapeutics & Nav1.8 Inhibitors Market — Intelligence Report's verified data. Modeled estimates — not investment advice.
- The report covers the Global Non-Opioid Pain Therapeutics & Nav1.8 Inhibitors Market within the Healthcare & Life Sciences sector.
- The market outlook period specified for the report is 2026–2033.
- The report is positioned as proprietary market outlook and competitive intelligence from Nexvora Intelligence.
- Notable point: Nav1.8 inhibitors are highlighted as a distinct focus within the broader non-opioid pain therapeutics market.