
Global Direct Air Capture & Durable Carbon Removal Market — Intelligence Report
Proprietary market outlook for engineered carbon removal demand, supply, infrastructure, and project economics, 2025–2032
Nexvora Intelligence market report on Global Direct Air Capture & Durable Carbon Removal Market — Intelligence Report.

per extra user
Instant access after payment. Secure via Razorpay.
The opening view — free.
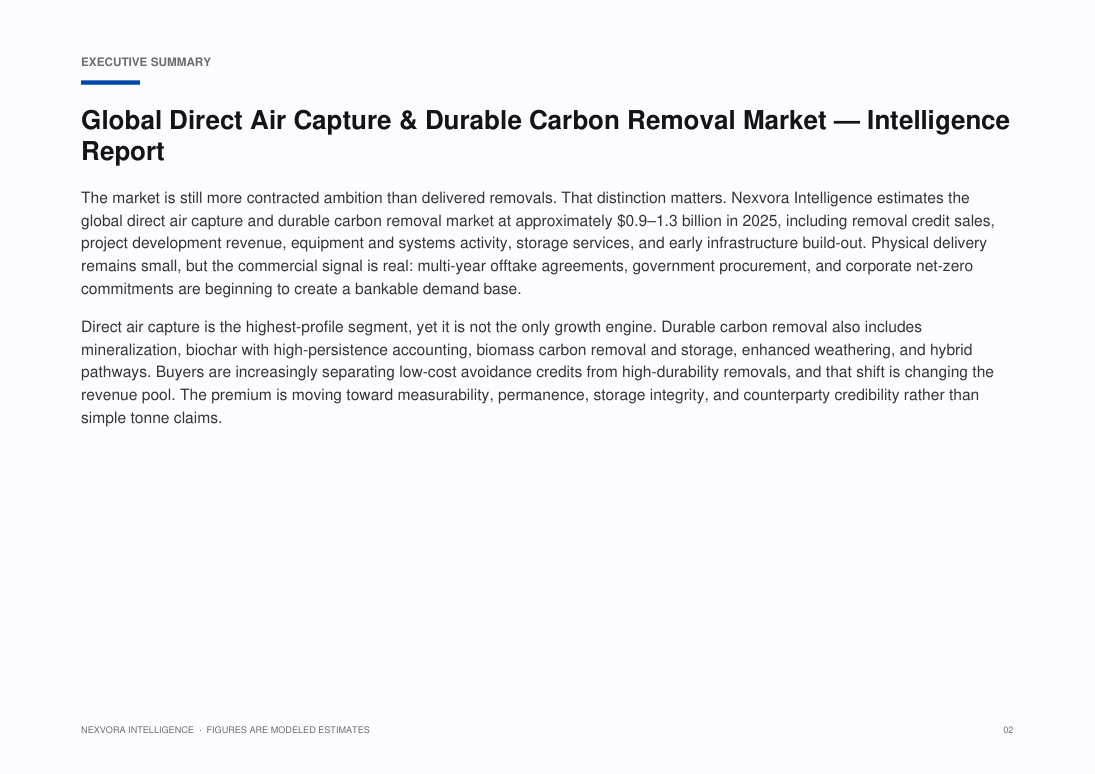
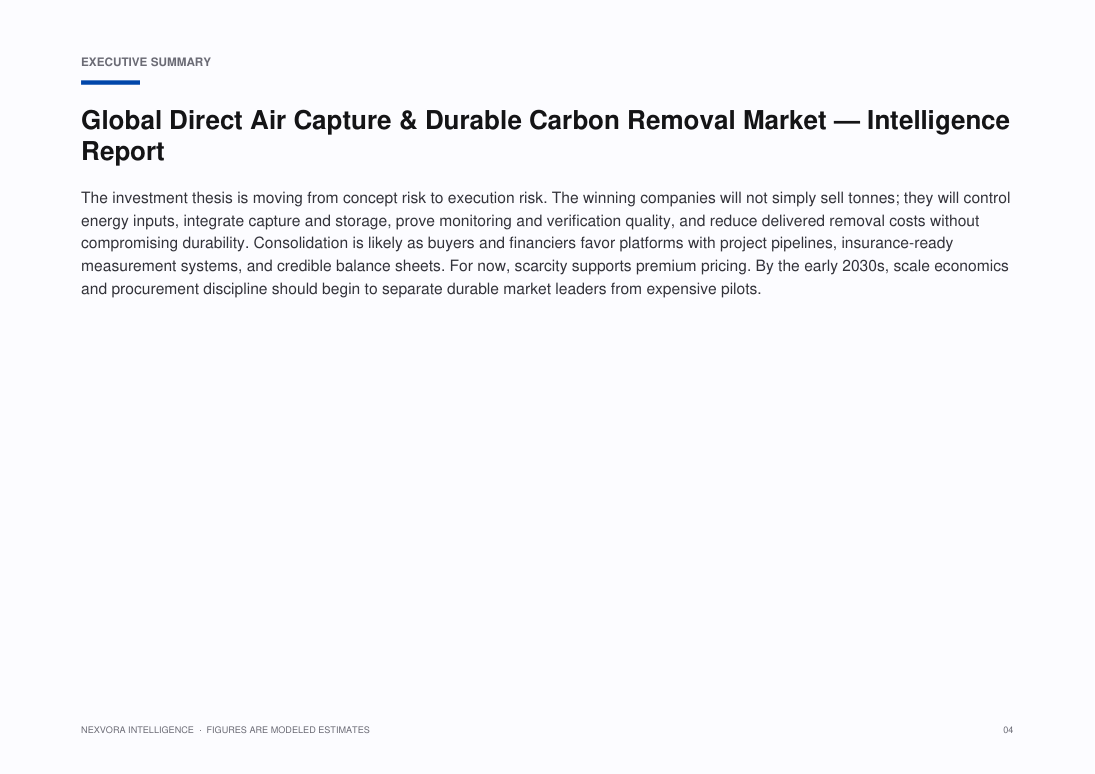
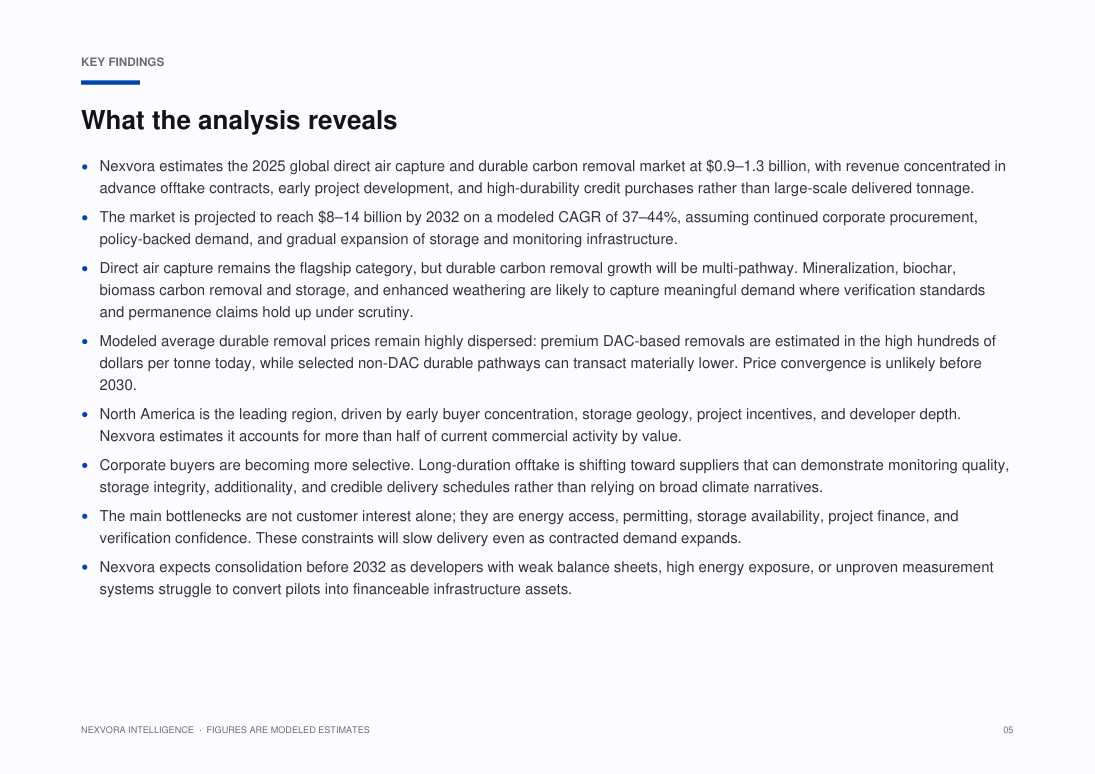
The market is still more contracted ambition than delivered removals. That distinction matters. Nexvora Intelligence estimates the global direct air capture and durable carbon removal market at approximately $•••–••• billion in 2025, including removal credit sales, project development revenue, equipment and systems activity, storage services, and early infrastructure build-out. Physical delivery remains small, but the commercial signal is real: multi-year offtake agreements, government procurement, and corporate net-zero commitments are beginning to create a bankable demand base.
Direct air capture is the highest-profile segment, yet it is not the only growth engine. Durable carbon removal also includes mineralization, biochar with high-persistence accounting, biomass carbon removal and storage, enhanced weathering, and hybrid pathways. Buyers are increasingly separating low-cost avoidance credits from high-durability removals, and that shift is changing the revenue pool. The premium is moving toward measurability, permanence, storage integrity, and counterparty credibility rather than simple tonne claims.
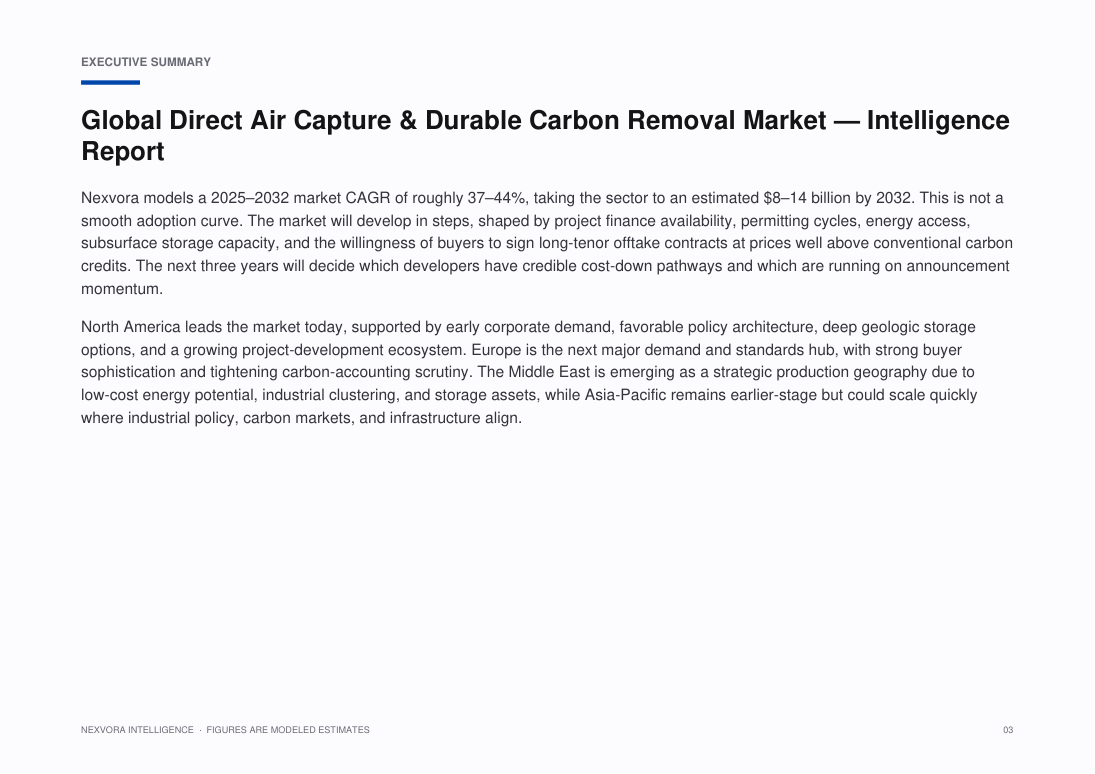
Nexvora models a 2025–2032 market CAGR of roughly 37–••%, taking the sector to an estimated $•••–••• billion by 2032. This is not a smooth adoption curve. The market will develop in steps, shaped by project finance availability, permitting cycles, energy access, subsurface storage capacity, and the willingness of buyers to sign long-tenor offtake contracts at prices well above conventional carbon credits. The next three years will decide which developers have credible cost-down pathways and which are running on announcement momentum.
North America leads the market today, supported by early corporate demand, favorable policy architecture, deep geologic storage options, and a growing project-development ecosystem. Europe is the next major demand and standards hub, with strong buyer sophistication and tightening carbon-accounting scrutiny. The Middle East is emerging as a strategic production geography due to low-cost energy potential, industrial clustering, and storage assets, while Asia-Pacific remains earlier-stage but could scale quickly where industrial policy, carbon markets, and infrastructure align.
Specific figures are hidden in this free preview. Unlock the report to see all modeled market sizes, forecasts and growth rates.
What this report covers.
Proprietary market outlook for engineered carbon removal demand, supply, infrastructure, and project economics, 2025–2032
Who this report is for.
- Corporate strategy, planning and M&A teams evaluating the market
- Investors, private equity and venture teams sizing the opportunity
- Product, marketing and go-to-market leaders
- Consultants and analysts building the competitive picture
- Executives planning market entry, expansion or investment
How this report is built.
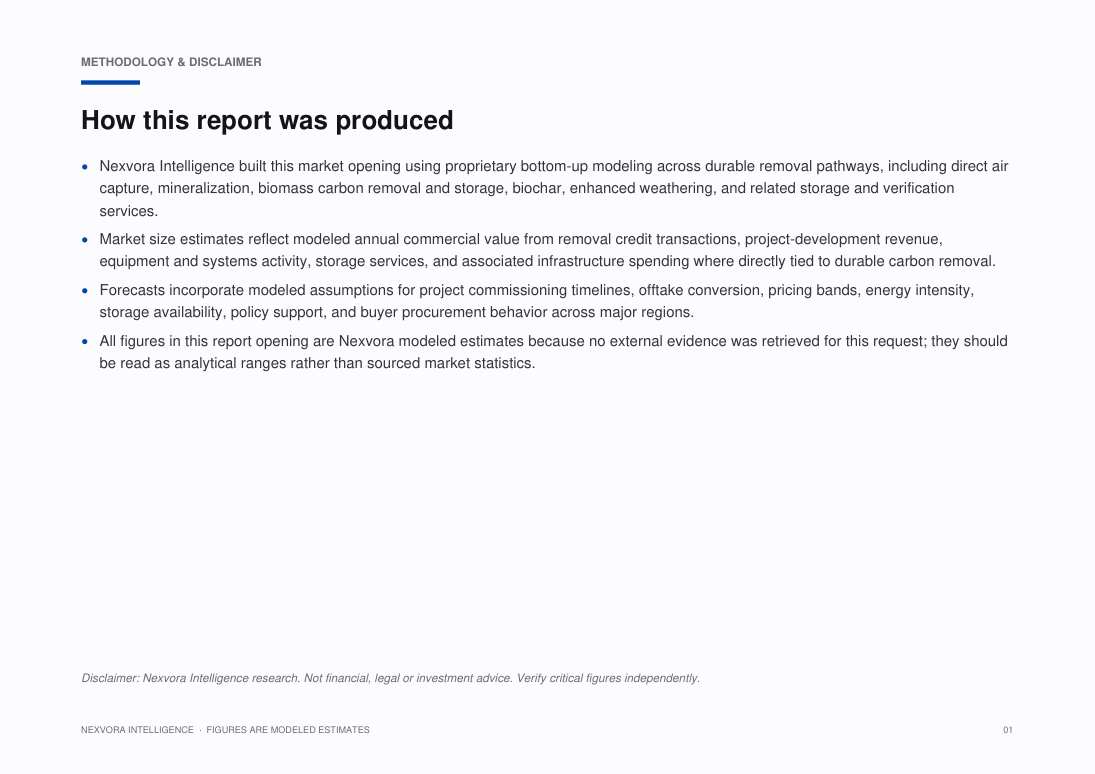
Nexvora Intelligence built this market opening using proprietary bottom-up modeling across durable removal pathways, including direct air capture, mineralization, biomass carbon removal and storage, biochar, enhanced weathering, and related storage and verification services.
Market size estimates reflect modeled annual commercial value from removal credit transactions, project-development revenue, equipment and systems activity, storage services, and associated infrastructure spending where directly tied to durable carbon removal.
Forecasts incorporate modeled assumptions for project commissioning timelines, offtake conversion, pricing bands, energy intensity, storage availability, policy support, and buyer procurement behavior across major regions.
All figures in this report opening are Nexvora modeled estimates because no external evidence was retrieved for this request; they should be read as analytical ranges rather than sourced market statistics.
What's inside — a number-free look.
A full outline of the figures and tables you'll get. Specific data, market sizes and forecasts are unlocked with purchase.
List of Figures
- Figure 1: Market Overview and Structure — Direct Air Capture & Durable Carbon Removal
- Figure 2: Market Size and Forecast Framework — Direct Air Capture & Durable Carbon Removal
- Figure 3: Value Chain and Ecosystem Analysis — Direct Air Capture & Durable Carbon Removal
- Figure 4: Market Dynamics — Drivers, Restraints and Opportunities — Direct Air Capture & Durable Carbon Removal
- Figure 5: Segment Contribution Analysis — Direct Air Capture & Durable Carbon Removal
- Figure 6: Regional Market Landscape — Direct Air Capture & Durable Carbon Removal
- Figure 7: Country-level Opportunity Mapping — Direct Air Capture & Durable Carbon Removal
- Figure 8: Competitive Positioning Matrix — Direct Air Capture & Durable Carbon Removal
- Figure 9: Market Share of Leading Players — Direct Air Capture & Durable Carbon Removal
- Figure 10: Adoption and Penetration Trends — Direct Air Capture & Durable Carbon Removal
- Figure 11: Technology and Innovation Landscape — Direct Air Capture & Durable Carbon Removal
- Figure 12: Pricing and Business Model Analysis — Direct Air Capture & Durable Carbon Removal
- Figure 13: Investment, Funding and M&A Landscape — Direct Air Capture & Durable Carbon Removal
- Figure 14: Regulatory and Policy Framework — Direct Air Capture & Durable Carbon Removal
- Figure 15: Porter's Five Forces Analysis — Direct Air Capture & Durable Carbon Removal
- Figure 16: PESTLE Analysis — Direct Air Capture & Durable Carbon Removal
- Figure 17: Growth Opportunity Heat Map — Direct Air Capture & Durable Carbon Removal
- Figure 18: Future Outlook and Strategic Roadmap — Direct Air Capture & Durable Carbon Removal
List of Tables
- Table 1: Market Segmentation Overview — Direct Air Capture & Durable Carbon Removal
- Table 2: Segment Definitions and Scope — Direct Air Capture & Durable Carbon Removal
- Table 3: Regional and Country Coverage Summary — Direct Air Capture & Durable Carbon Removal
- Table 4: Key Company Profiles and Offerings — Direct Air Capture & Durable Carbon Removal
- Table 5: Competitive Benchmarking Matrix — Direct Air Capture & Durable Carbon Removal
- Table 6: Product and Service Portfolio Mapping — Direct Air Capture & Durable Carbon Removal
- Table 7: Market Drivers, Restraints and Trends — Direct Air Capture & Durable Carbon Removal
- Table 8: Strategic Initiatives and Developments — Direct Air Capture & Durable Carbon Removal
- Table 9: Partnerships and Collaborations — Direct Air Capture & Durable Carbon Removal
- Table 10: Research Assumptions and Limitations — Direct Air Capture & Durable Carbon Removal
- Table 11: Data Sources and References — Direct Air Capture & Durable Carbon Removal
- Table 12: Report Scope and Coverage Summary — Direct Air Capture & Durable Carbon Removal
A look at the pages.
107 pages · 20 sections · charts & tables
A genuine peek at the opening pages. Unlock to read every page in full.
6 of 107 pages shown
Turn this market into a plan for your business.
Answer a few quick questions and unlock a personalised operational read — your maturity score, prioritised focus areas and quick wins — mapped to where this market is heading. Result delivered instantly and emailed to you.
- Maturity score & prioritised focus areas
- Practical quick wins and a recommended next step
Questions, answered.
How big is the Global Direct Air Capture & Durable Carbon Removal Market?
Nexvora models the Global Direct Air Capture & Durable Carbon Removal Market at approximately $0.9–1.3B, 2025E. Full market sizing, segmentation and forecasts are inside the report (modeled estimate).
What is the growth rate (CAGR) of the Global Direct Air Capture & Durable Carbon Removal Market?
The Global Direct Air Capture & Durable Carbon Removal Market is projected to grow at a CAGR of about 37–44%, 2025–2032E over the forecast period — a Nexvora modeled estimate detailed across the report's 20 sections.
What does this report include?
A complete market intelligence report — market sizing and forecasts, segmentation, regional and industry analysis, competitive landscape, trends, and strategic recommendations across 20 sections.
How do I access it after purchase?
Instantly, in your secure online viewer. Reports are view-only and available on any device from your library.
Are the figures sourced?
Quantitative figures are Nexvora modeled estimates unless explicitly cited to a referenced source within the report.
Can I buy access for my team?
Yes — add user seats at checkout, or subscribe for bulk access across multiple reports.
Nexvora Intelligence research report. All quantitative figures are modeled estimates — not audited data. Not financial or investment advice.
Carbon Capture Utilization & Storage Solutions vs Sustainable Aviation Fuel
Choose Carbon Capture Utilization & Storage Solutions if you need project-specific carbon capture, utilization and storage infrastructure and services from Shell. Choose Sustainable Aviation Fuel if your priority is an aviation fuel option: Neste MY Sustainable Aviation Fuel is HEFA-based, made from renewable waste and residue raw materials, approved through ASTM D7566 blending pathways, and approved for blends up to 50% with conventional jet fuel. These are different solution types, so the right choice depends on whether the buyer needs carbon management infrastructure or sustainable aviation fuel.
Grounded in published specifications — guidance, not an endorsement.
More market reports
Keep exploring intelligence in this and related sectors.
Global Small Modular Nuclear Reactors for Industrial and Data Center Power Market — Intelligence Report

Saudi Arabia Renewable Energy Market — Intelligence Report

Global Grid-Scale Battery Energy Storage & Long-Duration Storage Market — Intelligence Report

Global HVDC Transmission & Grid Interconnection Market — Intelligence Report
AI Analyst
Insights and answers generated live from Global Direct Air Capture & Durable Carbon Removal Market — Intelligence Report's verified data. Modeled estimates — not investment advice.
Not enough data yet to generate insights.