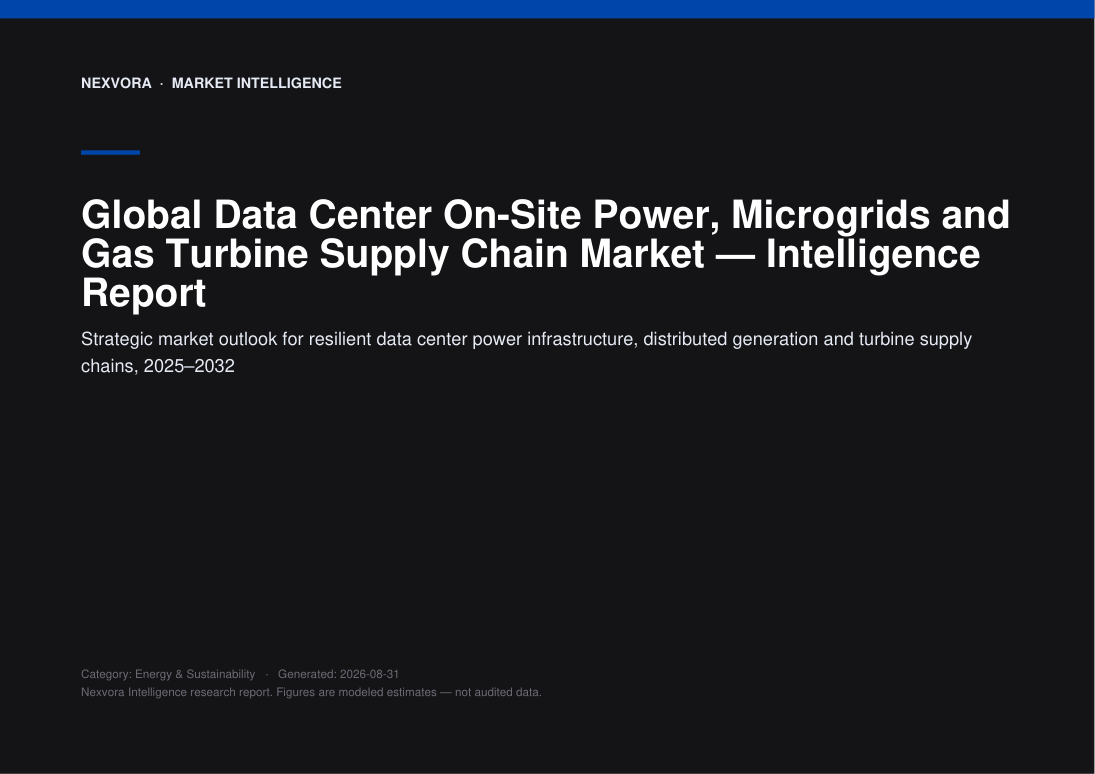
Global Data Center On-Site Power, Microgrids and Gas Turbine Supply Chain Market — Intelligence Report
Strategic market outlook for resilient data center power infrastructure, distributed generation and turbine supply chains, 2025–2032
Nexvora Intelligence market report on Global Data Center On-Site Power, Microgrids and Gas Turbine Supply Chain Market.

per extra user
Instant access after payment. Secure via Razorpay.
The opening view — free.
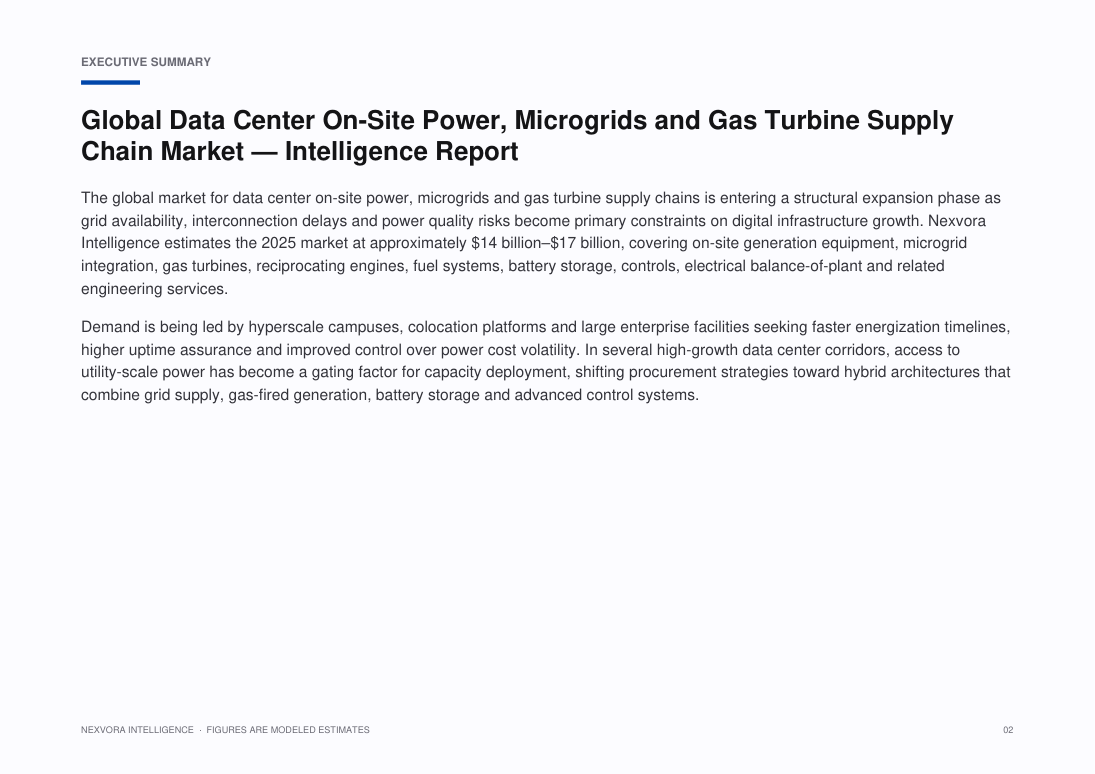
The global market for data center on-site power, microgrids and gas turbine supply chains is entering a structural expansion phase as grid availability, interconnection delays and power quality risks become primary constraints on digital infrastructure growth. Nexvora Intelligence estimates the 2025 market at approximately $•••–$•••, covering on-site generation equipment, microgrid integration, gas turbines, reciprocating engines, fuel systems, battery storage, controls, electrical balance-of-plant and related engineering services.
Demand is being led by hyperscale campuses, colocation platforms and large enterprise facilities seeking faster energization timelines, higher uptime assurance and improved control over power cost volatility. In several high-growth data center corridors, access to utility-scale power has become a gating factor for capacity deployment, shifting procurement strategies toward hybrid architectures that combine grid supply, gas-fired generation, battery storage and advanced control systems.
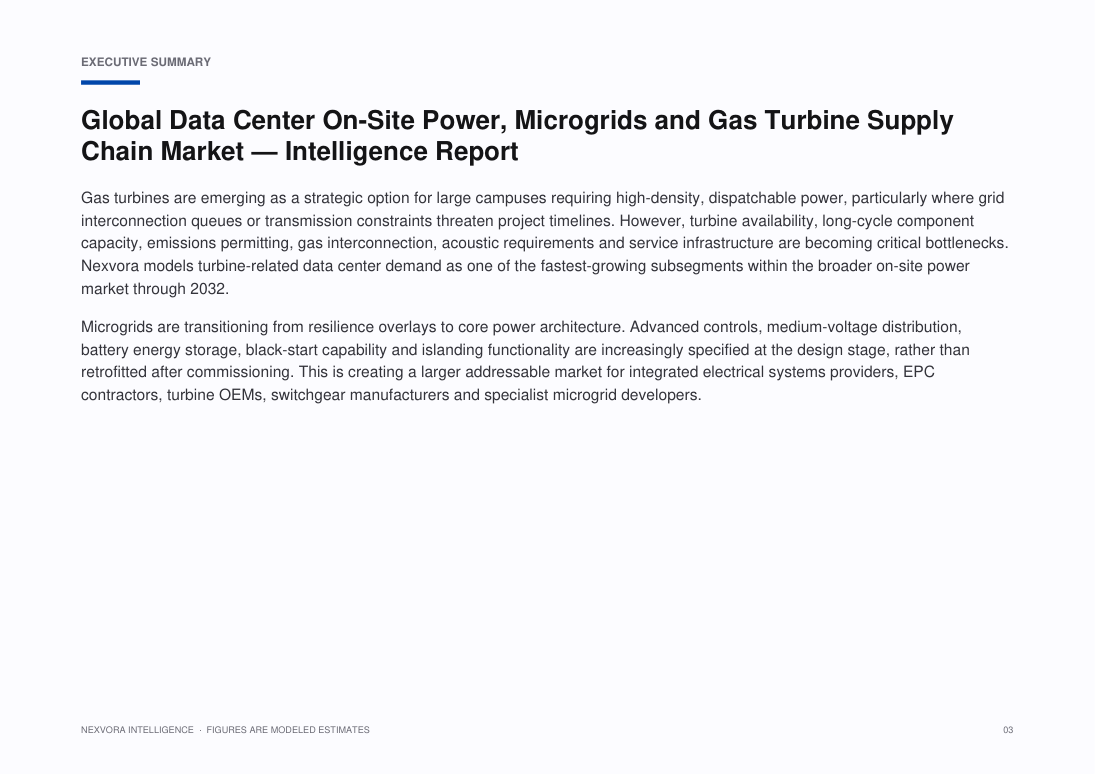
Gas turbines are emerging as a strategic option for large campuses requiring high-density, dispatchable power, particularly where grid interconnection queues or transmission constraints threaten project timelines. However, turbine availability, long-cycle component capacity, emissions permitting, gas interconnection, acoustic requirements and service infrastructure are becoming critical bottlenecks. Nexvora models turbine-related data center demand as one of the fastest-growing subsegments within the broader on-site power market through 2032.
Microgrids are transitioning from resilience overlays to core power architecture. Advanced controls, medium-voltage distribution, battery energy storage, black-start capability and islanding functionality are increasingly specified at the design stage, rather than retrofitted after commissioning. This is creating a larger addressable market for integrated electrical systems providers, EPC contractors, turbine OEMs, switchgear manufacturers and specialist microgrid developers.
Specific figures are hidden in this free preview. Unlock the report to see all modeled market sizes, forecasts and growth rates.
What this report covers.
Strategic market outlook for resilient data center power infrastructure, distributed generation and turbine supply chains, 2025–2032
Who this report is for.
- Corporate strategy, planning and M&A teams evaluating the market
- Investors, private equity and venture teams sizing the opportunity
- Product, marketing and go-to-market leaders
- Consultants and analysts building the competitive picture
- Executives planning market entry, expansion or investment
How this report is built.
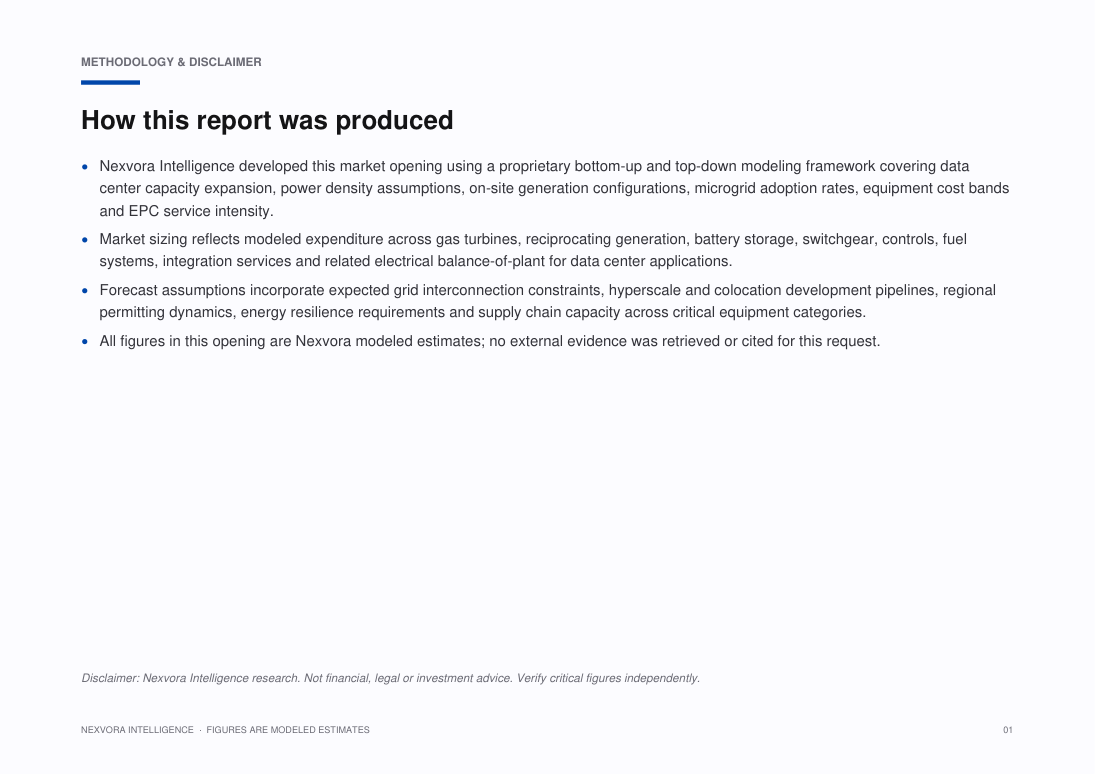
Nexvora Intelligence developed this market opening using a proprietary bottom-up and top-down modeling framework covering data center capacity expansion, power density assumptions, on-site generation configurations, microgrid adoption rates, equipment cost bands and EPC service intensity.
Market sizing reflects modeled expenditure across gas turbines, reciprocating generation, battery storage, switchgear, controls, fuel systems, integration services and related electrical balance-of-plant for data center applications.
Forecast assumptions incorporate expected grid interconnection constraints, hyperscale and colocation development pipelines, regional permitting dynamics, energy resilience requirements and supply chain capacity across critical equipment categories.
All figures in this opening are Nexvora modeled estimates; no external evidence was retrieved or cited for this request.
What's inside — a number-free look.
A full outline of the figures and tables you'll get. Specific data, market sizes and forecasts are unlocked with purchase.
List of Figures
- Figure 1: Market Overview and Structure — Data Center On-Site Power, Microgrids and Gas Turbine Supply Chain
- Figure 2: Market Size and Forecast Framework — Data Center On-Site Power, Microgrids and Gas Turbine Supply Chain
- Figure 3: Value Chain and Ecosystem Analysis — Data Center On-Site Power, Microgrids and Gas Turbine Supply Chain
- Figure 4: Market Dynamics — Drivers, Restraints and Opportunities — Data Center On-Site Power, Microgrids and Gas Turbine Supply Chain
- Figure 5: Segment Contribution Analysis — Data Center On-Site Power, Microgrids and Gas Turbine Supply Chain
- Figure 6: Regional Market Landscape — Data Center On-Site Power, Microgrids and Gas Turbine Supply Chain
- Figure 7: Country-level Opportunity Mapping — Data Center On-Site Power, Microgrids and Gas Turbine Supply Chain
- Figure 8: Competitive Positioning Matrix — Data Center On-Site Power, Microgrids and Gas Turbine Supply Chain
- Figure 9: Market Share of Leading Players — Data Center On-Site Power, Microgrids and Gas Turbine Supply Chain
- Figure 10: Adoption and Penetration Trends — Data Center On-Site Power, Microgrids and Gas Turbine Supply Chain
- Figure 11: Technology and Innovation Landscape — Data Center On-Site Power, Microgrids and Gas Turbine Supply Chain
- Figure 12: Pricing and Business Model Analysis — Data Center On-Site Power, Microgrids and Gas Turbine Supply Chain
- Figure 13: Investment, Funding and M&A Landscape — Data Center On-Site Power, Microgrids and Gas Turbine Supply Chain
- Figure 14: Regulatory and Policy Framework — Data Center On-Site Power, Microgrids and Gas Turbine Supply Chain
- Figure 15: Porter's Five Forces Analysis — Data Center On-Site Power, Microgrids and Gas Turbine Supply Chain
- Figure 16: PESTLE Analysis — Data Center On-Site Power, Microgrids and Gas Turbine Supply Chain
- Figure 17: Growth Opportunity Heat Map — Data Center On-Site Power, Microgrids and Gas Turbine Supply Chain
- Figure 18: Future Outlook and Strategic Roadmap — Data Center On-Site Power, Microgrids and Gas Turbine Supply Chain
List of Tables
- Table 1: Market Segmentation Overview — Data Center On-Site Power, Microgrids and Gas Turbine Supply Chain
- Table 2: Segment Definitions and Scope — Data Center On-Site Power, Microgrids and Gas Turbine Supply Chain
- Table 3: Regional and Country Coverage Summary — Data Center On-Site Power, Microgrids and Gas Turbine Supply Chain
- Table 4: Key Company Profiles and Offerings — Data Center On-Site Power, Microgrids and Gas Turbine Supply Chain
- Table 5: Competitive Benchmarking Matrix — Data Center On-Site Power, Microgrids and Gas Turbine Supply Chain
- Table 6: Product and Service Portfolio Mapping — Data Center On-Site Power, Microgrids and Gas Turbine Supply Chain
- Table 7: Market Drivers, Restraints and Trends — Data Center On-Site Power, Microgrids and Gas Turbine Supply Chain
- Table 8: Strategic Initiatives and Developments — Data Center On-Site Power, Microgrids and Gas Turbine Supply Chain
- Table 9: Partnerships and Collaborations — Data Center On-Site Power, Microgrids and Gas Turbine Supply Chain
- Table 10: Research Assumptions and Limitations — Data Center On-Site Power, Microgrids and Gas Turbine Supply Chain
- Table 11: Data Sources and References — Data Center On-Site Power, Microgrids and Gas Turbine Supply Chain
- Table 12: Report Scope and Coverage Summary — Data Center On-Site Power, Microgrids and Gas Turbine Supply Chain
A look at the pages.
107 pages · 20 sections · charts & tables
A genuine peek at the opening pages. Unlock to read every page in full.
6 of 107 pages shown
Turn this market into a plan for your business.
Answer a few quick questions and unlock a personalised operational read — your maturity score, prioritised focus areas and quick wins — mapped to where this market is heading. Result delivered instantly and emailed to you.
- Maturity score & prioritised focus areas
- Practical quick wins and a recommended next step
Questions, answered.
How big is the Global Data Center On-Site Power, Microgrids and Gas Turbine Supply Chain Market?
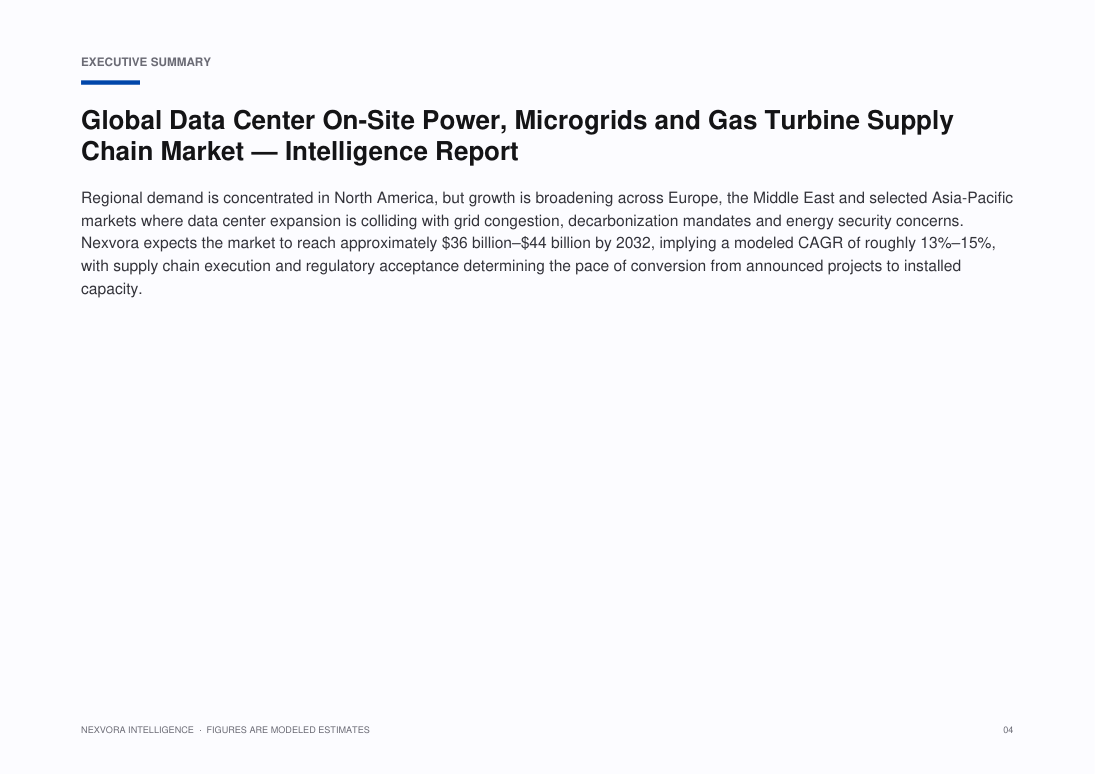
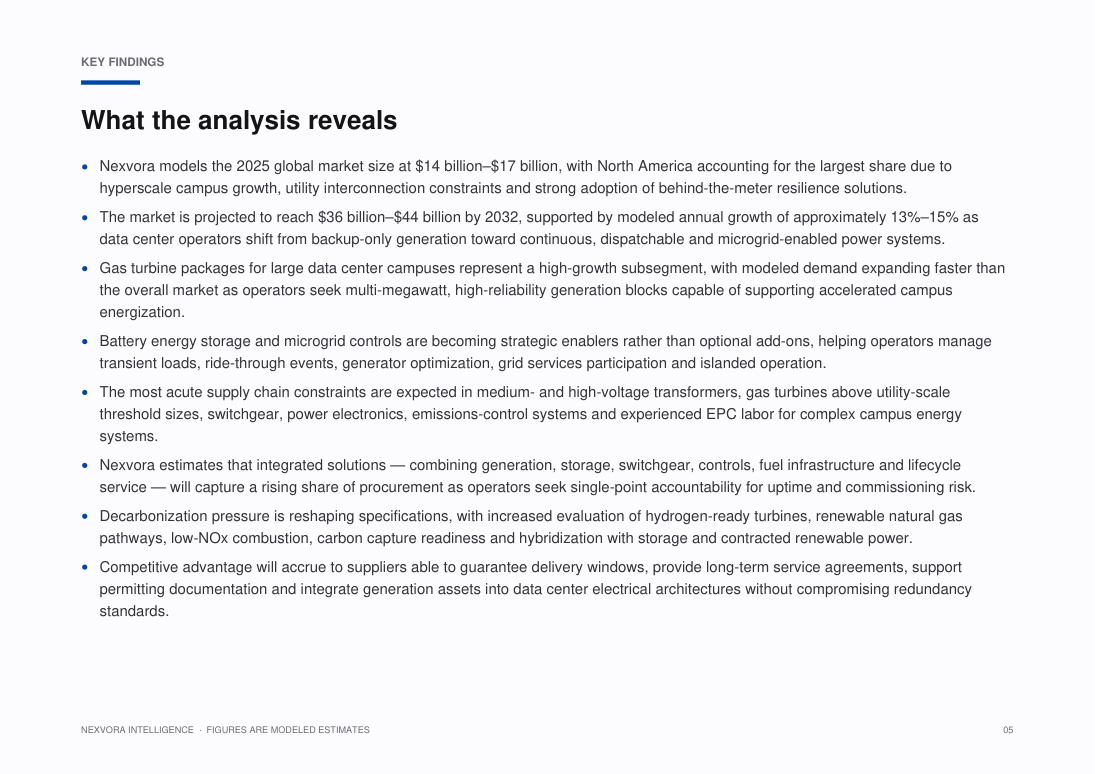
Nexvora models the Global Data Center On-Site Power, Microgrids and Gas Turbine Supply Chain Market at approximately $14B–$17B. Full market sizing, segmentation and forecasts are inside the report (modeled estimate).
What is the growth rate (CAGR) of the Global Data Center On-Site Power, Microgrids and Gas Turbine Supply Chain Market?
The Global Data Center On-Site Power, Microgrids and Gas Turbine Supply Chain Market is projected to grow at a CAGR of about 13%–15% over the forecast period — a Nexvora modeled estimate detailed across the report's 20 sections.
What does this report include?
A complete market intelligence report — market sizing and forecasts, segmentation, regional and industry analysis, competitive landscape, trends, and strategic recommendations across 20 sections.
How do I access it after purchase?
Instantly, in your secure online viewer. Reports are view-only and available on any device from your library.
Are the figures sourced?
Quantitative figures are Nexvora modeled estimates unless explicitly cited to a referenced source within the report.
Can I buy access for my team?
Yes — add user seats at checkout, or subscribe for bulk access across multiple reports.
Nexvora Intelligence research report. All quantitative figures are modeled estimates — not audited data. Not financial or investment advice.
More market reports
Keep exploring intelligence in this and related sectors.

Global Data Center Power & Liquid Cooling Infrastructure Market — Accelerated Compute, Grid Constraints & Thermal Management Outlook

Beyond the Grid: Space-Based Solar Power — Strategic Intelligence Report

Global Direct Air Capture, Durable Carbon Removal Offtakes and MRV Infrastructure Market — Intelligence Report