
Global Co-Packaged Optics, 1.6T Transceivers & Optical Interconnects for Accelerated Data Centers — Intelligence Report
Nexvora Intelligence outlook on next-generation data center optical connectivity, 2025–2032
Nexvora Intelligence market report on Global Co-Packaged Optics, 1.6T Transceivers & Optical Interconnects for AI Data Centers Market.
per extra user
Instant access after payment. Secure via Razorpay.
The opening view — free.
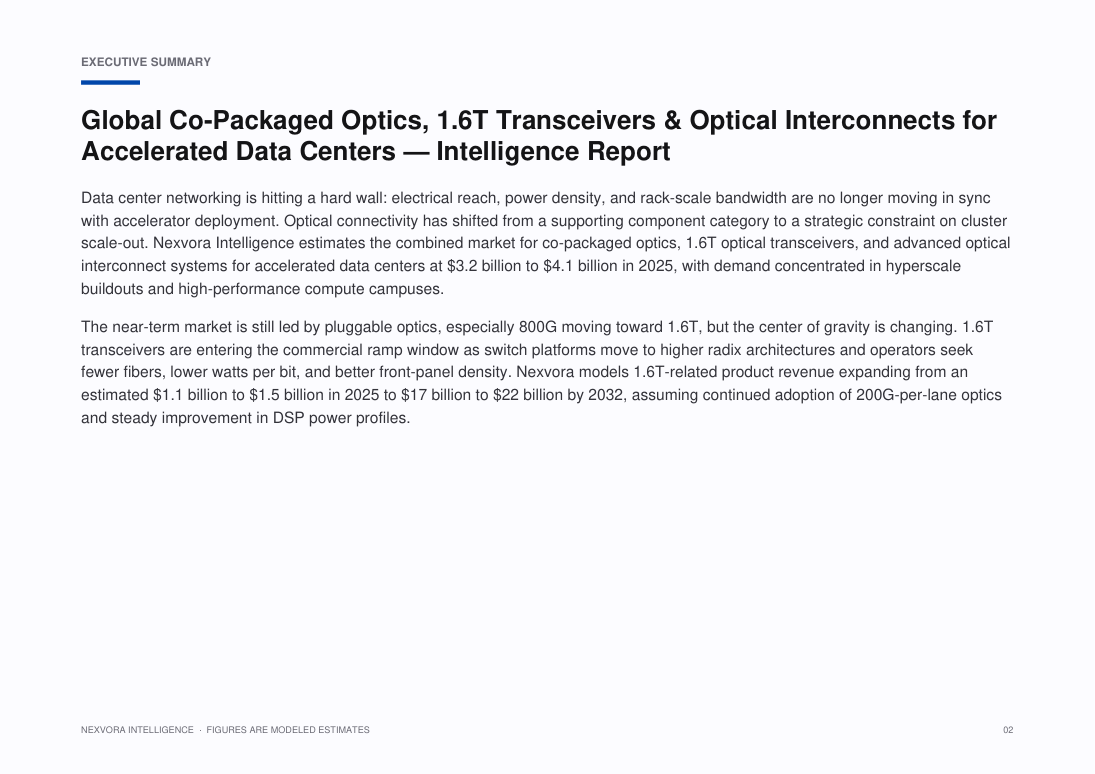
Data center networking is hitting a hard wall: electrical reach, power density, and rack-scale bandwidth are no longer moving in sync with accelerator deployment. Optical connectivity has shifted from a supporting component category to a strategic constraint on cluster scale-out. Nexvora Intelligence estimates the combined market for co-packaged optics, 1.6T optical transceivers, and advanced optical interconnect systems for accelerated data centers at $••• to $••• in 2025, with demand concentrated in hyperscale buildouts and high-performance compute campuses.
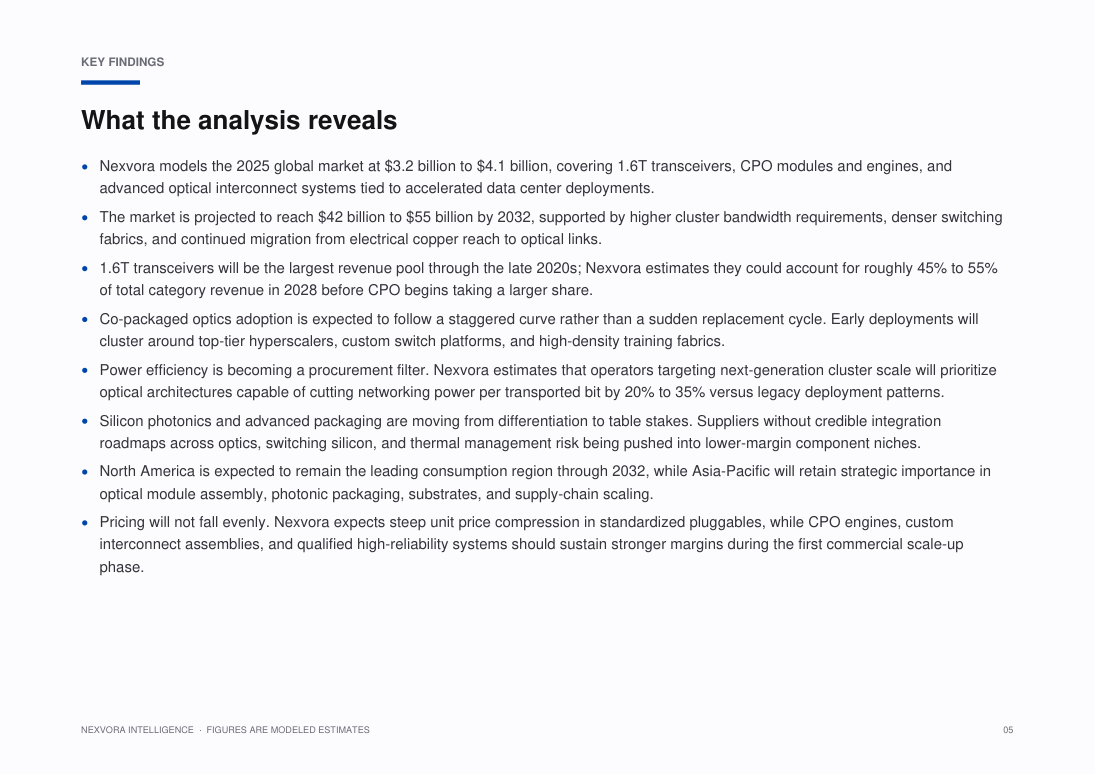
The near-term market is still led by pluggable optics, especially 800G moving toward 1.6T, but the center of gravity is changing. 1.6T transceivers are entering the commercial ramp window as switch platforms move to higher radix architectures and operators seek fewer fibers, lower watts per bit, and better front-panel density. Nexvora models 1.6T-related product revenue expanding from an estimated $••• to $••• in 2025 to $••• to $••• by 2032, assuming continued adoption of 200G-per-lane optics and steady improvement in DSP power profiles.
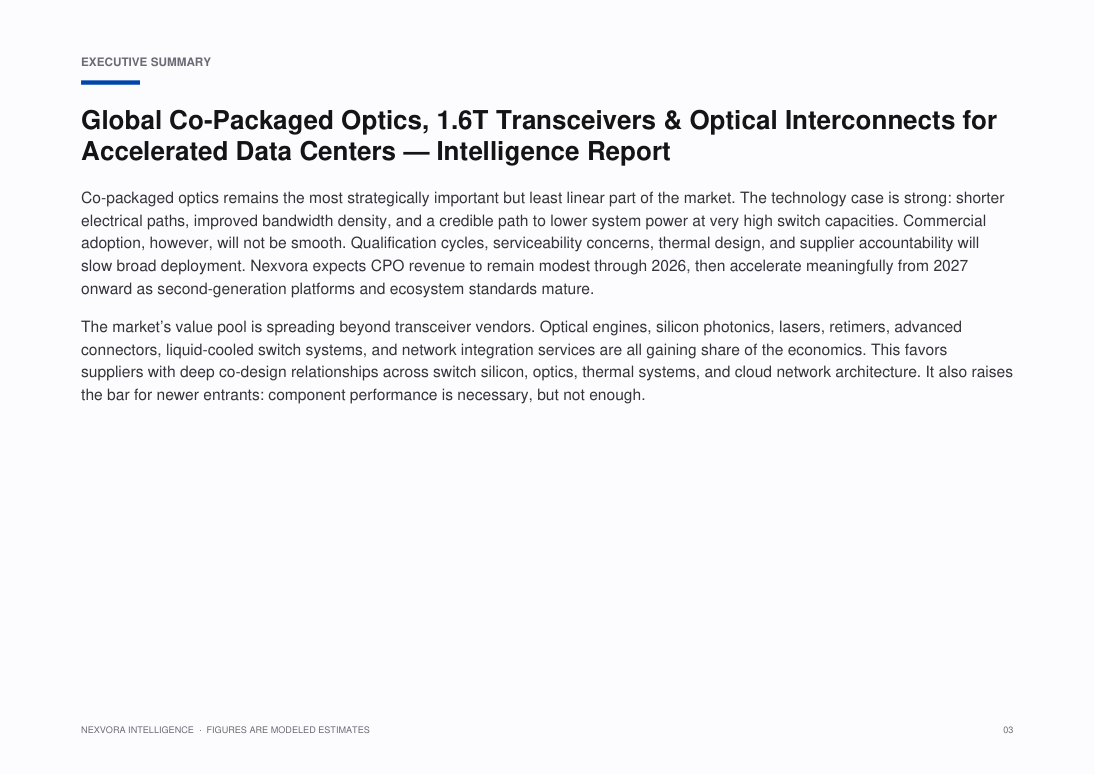
Co-packaged optics remains the most strategically important but least linear part of the market. The technology case is strong: shorter electrical paths, improved bandwidth density, and a credible path to lower system power at very high switch capacities. Commercial adoption, however, will not be smooth. Qualification cycles, serviceability concerns, thermal design, and supplier accountability will slow broad deployment. Nexvora expects CPO revenue to remain modest through 2026, then accelerate meaningfully from 2027 onward as second-generation platforms and ecosystem standards mature.
The market’s value pool is spreading beyond transceiver vendors. Optical engines, silicon photonics, lasers, retimers, advanced connectors, liquid-cooled switch systems, and network integration services are all gaining share of the economics. This favors suppliers with deep co-design relationships across switch silicon, optics, thermal systems, and cloud network architecture. It also raises the bar for newer entrants: component performance is necessary, but not enough.
Specific figures are hidden in this free preview. Unlock the report to see all modeled market sizes, forecasts and growth rates.
What this report covers.
Nexvora Intelligence outlook on next-generation data center optical connectivity, 2025–2032
Who this report is for.
- Corporate strategy, planning and M&A teams evaluating the market
- Investors, private equity and venture teams sizing the opportunity
- Product, marketing and go-to-market leaders
- Consultants and analysts building the competitive picture
- Executives planning market entry, expansion or investment
How this report is built.
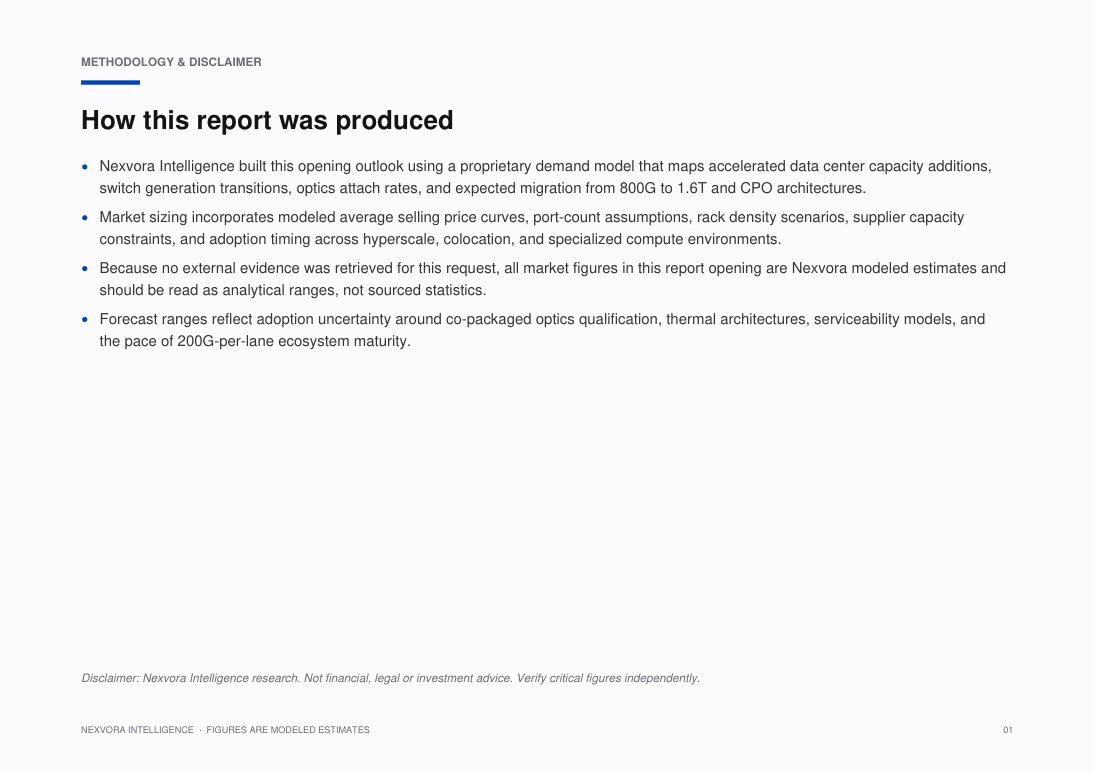
Nexvora Intelligence built this opening outlook using a proprietary demand model that maps accelerated data center capacity additions, switch generation transitions, optics attach rates, and expected migration from 800G to 1.6T and CPO architectures.
Market sizing incorporates modeled average selling price curves, port-count assumptions, rack density scenarios, supplier capacity constraints, and adoption timing across hyperscale, colocation, and specialized compute environments.
Because no external evidence was retrieved for this request, all market figures in this report opening are Nexvora modeled estimates and should be read as analytical ranges, not sourced statistics.
Forecast ranges reflect adoption uncertainty around co-packaged optics qualification, thermal architectures, serviceability models, and the pace of 200G-per-lane ecosystem maturity.
What's inside — a number-free look.
A full outline of the figures and tables you'll get. Specific data, market sizes and forecasts are unlocked with purchase.
List of Figures
- Figure 1: Market Overview and Structure — Co-Packaged Optics, 1.6T Transceivers & Optical Interconnects for Accelerated Data Centers
- Figure 2: Market Size and Forecast Framework — Co-Packaged Optics, 1.6T Transceivers & Optical Interconnects for Accelerated Data Centers
- Figure 3: Value Chain and Ecosystem Analysis — Co-Packaged Optics, 1.6T Transceivers & Optical Interconnects for Accelerated Data Centers
- Figure 4: Market Dynamics — Drivers, Restraints and Opportunities — Co-Packaged Optics, 1.6T Transceivers & Optical Interconnects for Accelerated Data Centers
- Figure 5: Segment Contribution Analysis — Co-Packaged Optics, 1.6T Transceivers & Optical Interconnects for Accelerated Data Centers
- Figure 6: Regional Market Landscape — Co-Packaged Optics, 1.6T Transceivers & Optical Interconnects for Accelerated Data Centers
- Figure 7: Country-level Opportunity Mapping — Co-Packaged Optics, 1.6T Transceivers & Optical Interconnects for Accelerated Data Centers
- Figure 8: Competitive Positioning Matrix — Co-Packaged Optics, 1.6T Transceivers & Optical Interconnects for Accelerated Data Centers
- Figure 9: Market Share of Leading Players — Co-Packaged Optics, 1.6T Transceivers & Optical Interconnects for Accelerated Data Centers
- Figure 10: Adoption and Penetration Trends — Co-Packaged Optics, 1.6T Transceivers & Optical Interconnects for Accelerated Data Centers
- Figure 11: Technology and Innovation Landscape — Co-Packaged Optics, 1.6T Transceivers & Optical Interconnects for Accelerated Data Centers
- Figure 12: Pricing and Business Model Analysis — Co-Packaged Optics, 1.6T Transceivers & Optical Interconnects for Accelerated Data Centers
- Figure 13: Investment, Funding and M&A Landscape — Co-Packaged Optics, 1.6T Transceivers & Optical Interconnects for Accelerated Data Centers
- Figure 14: Regulatory and Policy Framework — Co-Packaged Optics, 1.6T Transceivers & Optical Interconnects for Accelerated Data Centers
- Figure 15: Porter's Five Forces Analysis — Co-Packaged Optics, 1.6T Transceivers & Optical Interconnects for Accelerated Data Centers
- Figure 16: PESTLE Analysis — Co-Packaged Optics, 1.6T Transceivers & Optical Interconnects for Accelerated Data Centers
- Figure 17: Growth Opportunity Heat Map — Co-Packaged Optics, 1.6T Transceivers & Optical Interconnects for Accelerated Data Centers
- Figure 18: Future Outlook and Strategic Roadmap — Co-Packaged Optics, 1.6T Transceivers & Optical Interconnects for Accelerated Data Centers
List of Tables
- Table 1: Market Segmentation Overview — Co-Packaged Optics, 1.6T Transceivers & Optical Interconnects for Accelerated Data Centers
- Table 2: Segment Definitions and Scope — Co-Packaged Optics, 1.6T Transceivers & Optical Interconnects for Accelerated Data Centers
- Table 3: Regional and Country Coverage Summary — Co-Packaged Optics, 1.6T Transceivers & Optical Interconnects for Accelerated Data Centers
- Table 4: Key Company Profiles and Offerings — Co-Packaged Optics, 1.6T Transceivers & Optical Interconnects for Accelerated Data Centers
- Table 5: Competitive Benchmarking Matrix — Co-Packaged Optics, 1.6T Transceivers & Optical Interconnects for Accelerated Data Centers
- Table 6: Product and Service Portfolio Mapping — Co-Packaged Optics, 1.6T Transceivers & Optical Interconnects for Accelerated Data Centers
- Table 7: Market Drivers, Restraints and Trends — Co-Packaged Optics, 1.6T Transceivers & Optical Interconnects for Accelerated Data Centers
- Table 8: Strategic Initiatives and Developments — Co-Packaged Optics, 1.6T Transceivers & Optical Interconnects for Accelerated Data Centers
- Table 9: Partnerships and Collaborations — Co-Packaged Optics, 1.6T Transceivers & Optical Interconnects for Accelerated Data Centers
- Table 10: Research Assumptions and Limitations — Co-Packaged Optics, 1.6T Transceivers & Optical Interconnects for Accelerated Data Centers
- Table 11: Data Sources and References — Co-Packaged Optics, 1.6T Transceivers & Optical Interconnects for Accelerated Data Centers
- Table 12: Report Scope and Coverage Summary — Co-Packaged Optics, 1.6T Transceivers & Optical Interconnects for Accelerated Data Centers
A look at the pages.
107 pages · 20 sections · charts & tables
A genuine peek at the opening pages. Unlock to read every page in full.
6 of 107 pages shown
Turn this market into a plan for your business.
Answer a few quick questions and unlock a personalised operational read — your maturity score, prioritised focus areas and quick wins — mapped to where this market is heading. Result delivered instantly and emailed to you.
- Maturity score & prioritised focus areas
- Practical quick wins and a recommended next step
Questions, answered.
How big is the Global Co-Packaged Optics, 1.6T Transceivers & Optical Interconnects for Accelerated Data Centers?
Nexvora models the Global Co-Packaged Optics, 1.6T Transceivers & Optical Interconnects for Accelerated Data Centers at approximately $3.2B–$4.1B. Full market sizing, segmentation and forecasts are inside the report (modeled estimate).
What is the growth rate (CAGR) of the Global Co-Packaged Optics, 1.6T Transceivers & Optical Interconnects for Accelerated Data Centers?
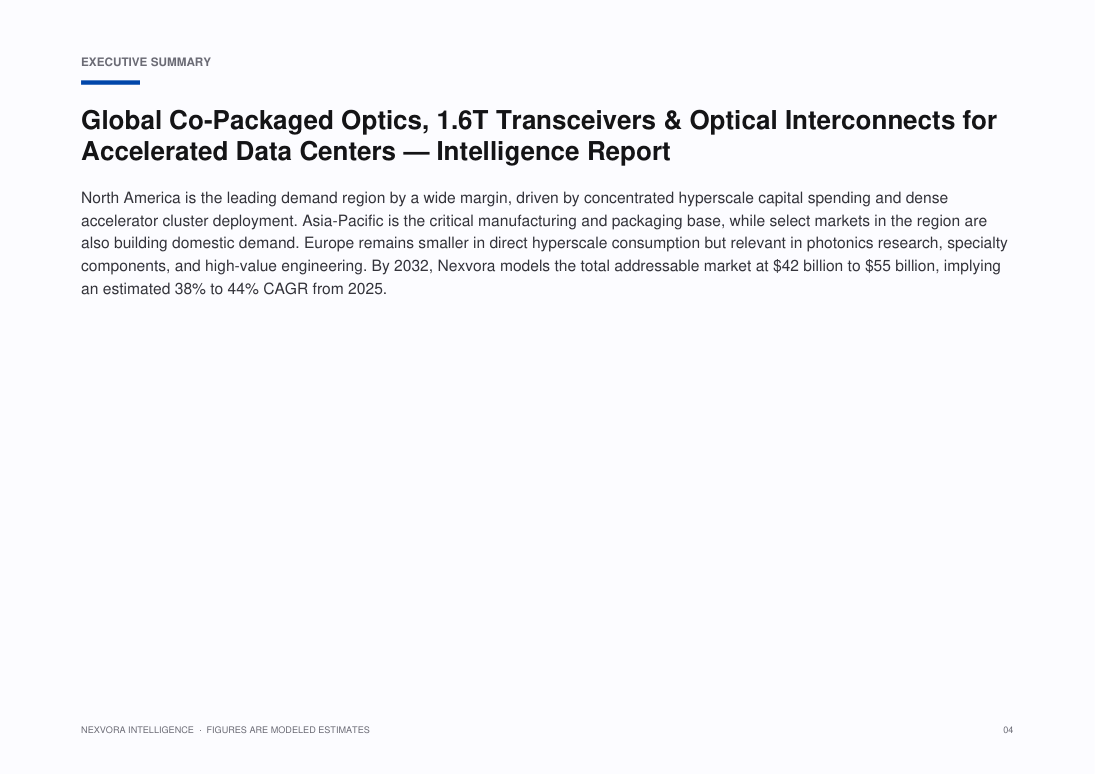
The Global Co-Packaged Optics, 1.6T Transceivers & Optical Interconnects for Accelerated Data Centers is projected to grow at a CAGR of about 38%–44% over the forecast period — a Nexvora modeled estimate detailed across the report's 20 sections.
What does this report include?
A complete market intelligence report — market sizing and forecasts, segmentation, regional and industry analysis, competitive landscape, trends, and strategic recommendations across 20 sections.
How do I access it after purchase?
Instantly, in your secure online viewer. Reports are view-only and available on any device from your library.
Are the figures sourced?
Quantitative figures are Nexvora modeled estimates unless explicitly cited to a referenced source within the report.
Can I buy access for my team?
Yes — add user seats at checkout, or subscribe for bulk access across multiple reports.
Nexvora Intelligence research report. All quantitative figures are modeled estimates — not audited data. Not financial or investment advice.
Optical Transceivers vs Precision Agriculture Technology
Choose Optical Transceivers if you specifically need optical transceivers from Coherent, but the available facts do not disclose performance details such as data rates, reach, or form factors. Choose Precision Agriculture Technology if you need a precision agriculture hardware, software, and connected-services suite built around John Deere Operations Center, with JDLink connectivity and AutoTrac on supported equipment. The right choice depends mainly on whether the buyer is addressing optical networking needs or connected farm operations.
Grounded in published specifications — guidance, not an endorsement.
More market reports
Keep exploring intelligence in this and related sectors.
Global Autonomous Security Operations & SOC Platforms Market — Intelligence Report
Global Sovereign Accelerated Cloud & GPU-as-a-Service Platforms Market — Intelligence Report
Global Neocloud & Sovereign GPU-as-a-Service Infrastructure Market — Intelligence Report
Global Software Development Agents & Coding Automation Platforms Market — Intelligence Report
AI Analyst
Insights and answers generated live from Global Co-Packaged Optics, 1.6T Transceivers & Optical Interconnects for Accelerated Data Centers — Intelligence Report's verified data. Modeled estimates — not investment advice.
- The report covers the global market for co-packaged optics, 1.6T transceivers, and optical interconnects in accelerated data centers.
- The sector classification is Technology & Software.
- The outlook period specified for next-generation data center optical connectivity is 2025–2032.
- Notable: The report is positioned specifically around optical connectivity for AI data centers.