
Global Autonomous Revenue Cycle Management & Medical Billing Market — Intelligence Report
Proprietary market outlook and competitive intelligence, 2025–2032
Nexvora Intelligence market report on Global AI Revenue Cycle Management & Autonomous Medical Billing Market — Intelligence Report.

per extra user
Instant access after payment. Secure via Razorpay.
The opening view — free.
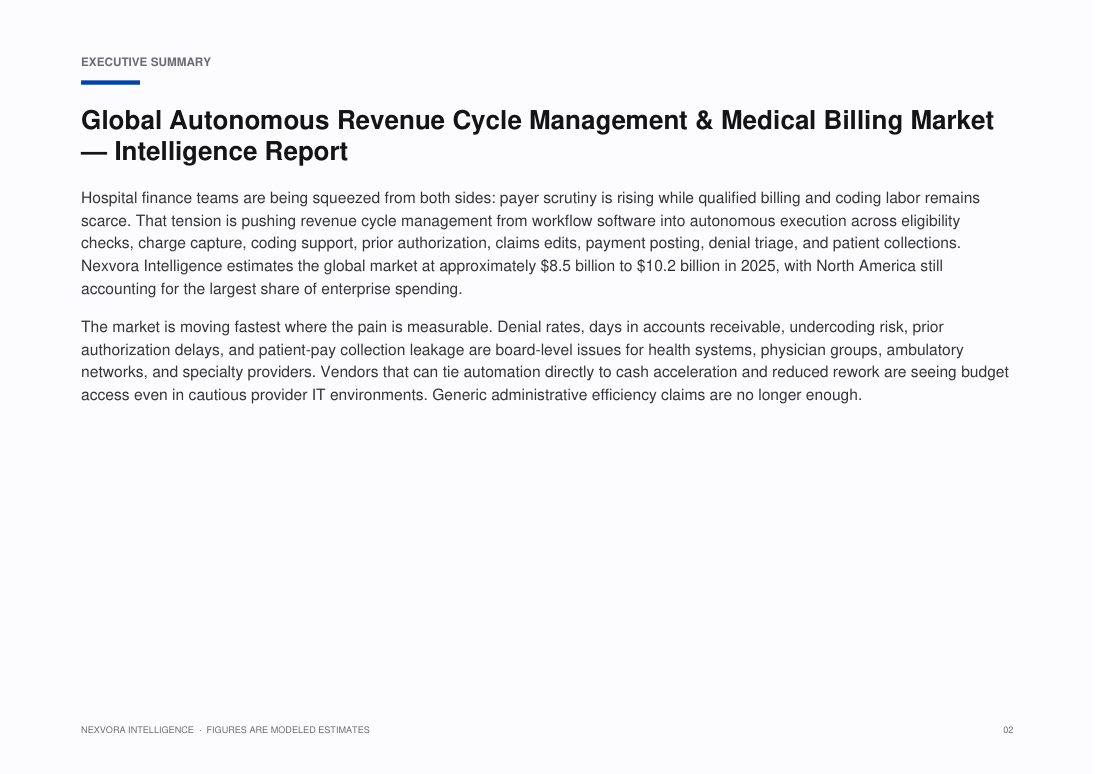
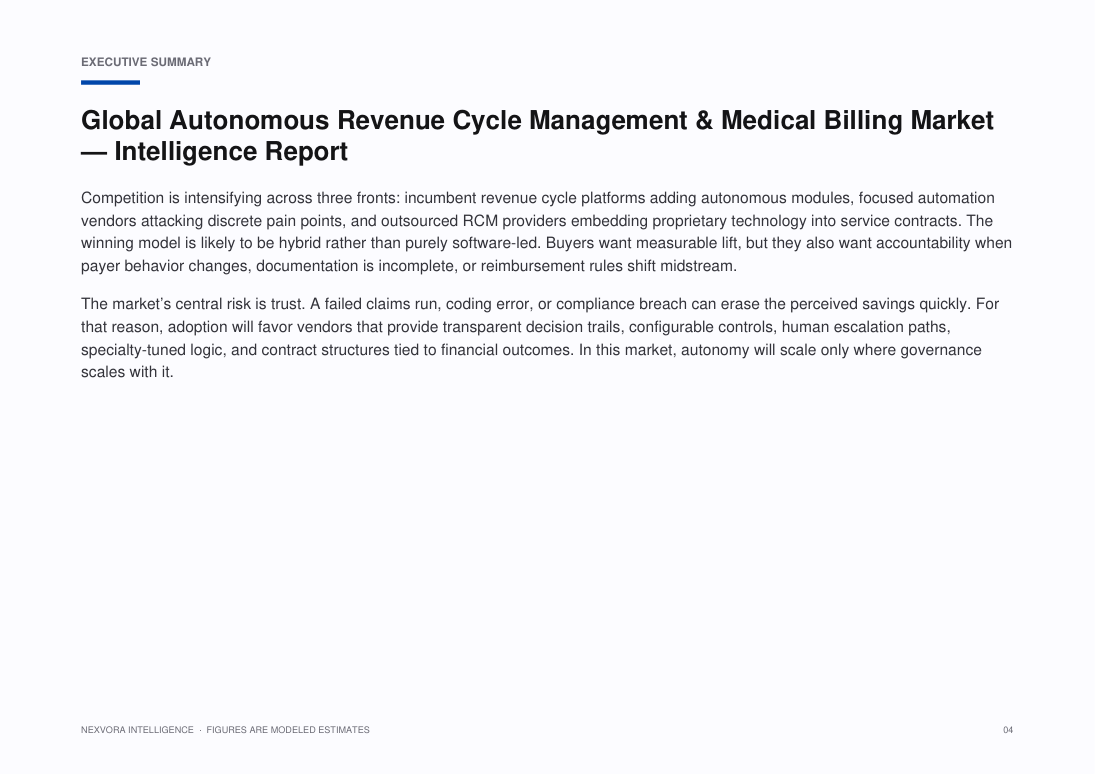
Hospital finance teams are being squeezed from both sides: payer scrutiny is rising while qualified billing and coding labor remains scarce. That tension is pushing revenue cycle management from workflow software into autonomous execution across eligibility checks, charge capture, coding support, prior authorization, claims edits, payment posting, denial triage, and patient collections. Nexvora Intelligence estimates the global market at approximately $••• to $••• in 2025, with North America still accounting for the largest share of enterprise spending.
The market is moving fastest where the pain is measurable. Denial rates, days in accounts receivable, undercoding risk, prior authorization delays, and patient-pay collection leakage are board-level issues for health systems, physician groups, ambulatory networks, and specialty providers. Vendors that can tie automation directly to cash acceleration and reduced rework are seeing budget access even in cautious provider IT environments. Generic administrative efficiency claims are no longer enough.
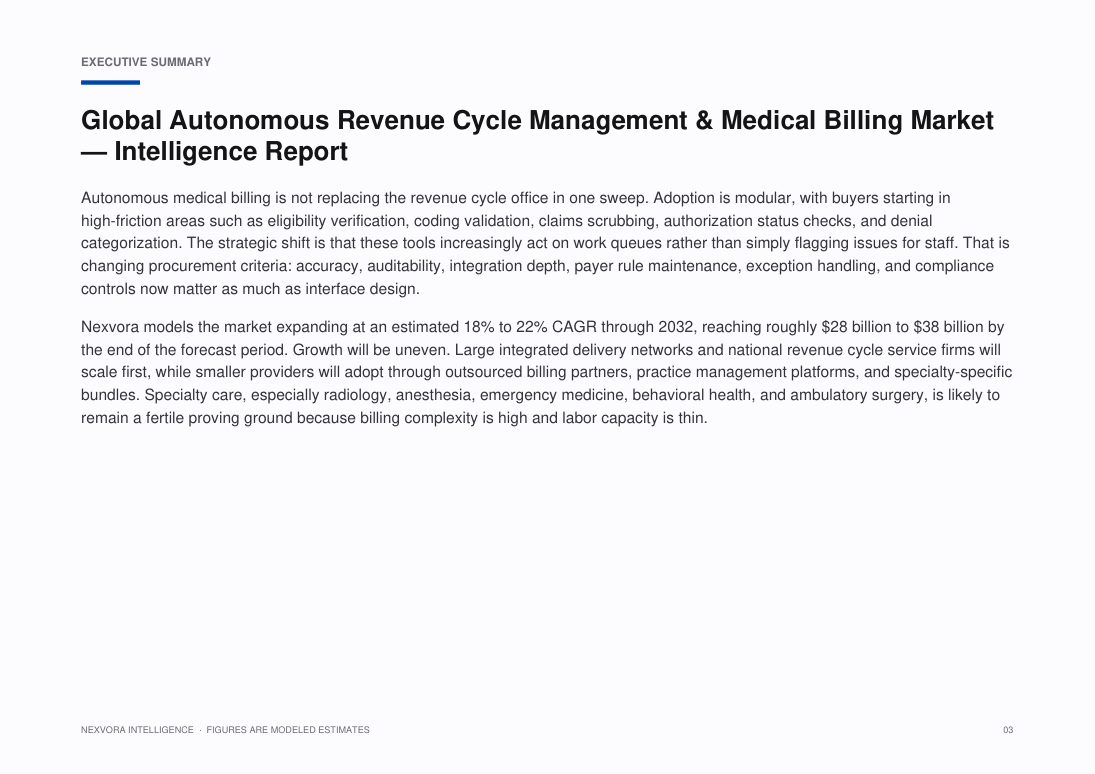
Autonomous medical billing is not replacing the revenue cycle office in one sweep. Adoption is modular, with buyers starting in high-friction areas such as eligibility verification, coding validation, claims scrubbing, authorization status checks, and denial categorization. The strategic shift is that these tools increasingly act on work queues rather than simply flagging issues for staff. That is changing procurement criteria: accuracy, auditability, integration depth, payer rule maintenance, exception handling, and compliance controls now matter as much as interface design.
Nexvora models the market expanding at an estimated ••% to ••% CAGR through 2032, reaching roughly $••• to $••• by the end of the forecast period. Growth will be uneven. Large integrated delivery networks and national revenue cycle service firms will scale first, while smaller providers will adopt through outsourced billing partners, practice management platforms, and specialty-specific bundles. Specialty care, especially radiology, anesthesia, emergency medicine, behavioral health, and ambulatory surgery, is likely to remain a fertile proving ground because billing complexity is high and labor capacity is thin.
Specific figures are hidden in this free preview. Unlock the report to see all modeled market sizes, forecasts and growth rates.
What this report covers.
Proprietary market outlook and competitive intelligence, 2025–2032
Who this report is for.
- Corporate strategy, planning and M&A teams evaluating the market
- Investors, private equity and venture teams sizing the opportunity
- Product, marketing and go-to-market leaders
- Consultants and analysts building the competitive picture
- Executives planning market entry, expansion or investment
How this report is built.
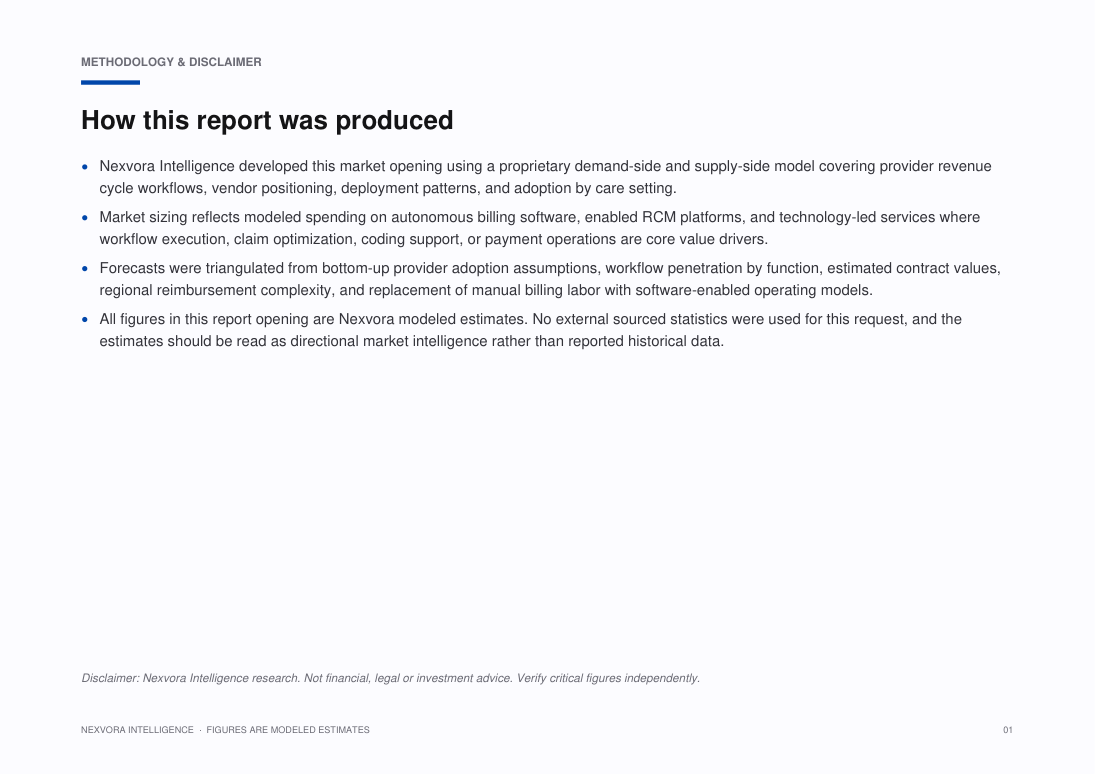
Nexvora Intelligence developed this market opening using a proprietary demand-side and supply-side model covering provider revenue cycle workflows, vendor positioning, deployment patterns, and adoption by care setting.
Market sizing reflects modeled spending on autonomous billing software, enabled RCM platforms, and technology-led services where workflow execution, claim optimization, coding support, or payment operations are core value drivers.
Forecasts were triangulated from bottom-up provider adoption assumptions, workflow penetration by function, estimated contract values, regional reimbursement complexity, and replacement of manual billing labor with software-enabled operating models.
All figures in this report opening are Nexvora modeled estimates. No external sourced statistics were used for this request, and the estimates should be read as directional market intelligence rather than reported historical data.
What's inside — a number-free look.
A full outline of the figures and tables you'll get. Specific data, market sizes and forecasts are unlocked with purchase.
List of Figures
- Figure 1: Market Overview and Structure — Autonomous Revenue Cycle Management & Medical Billing
- Figure 2: Market Size and Forecast Framework — Autonomous Revenue Cycle Management & Medical Billing
- Figure 3: Value Chain and Ecosystem Analysis — Autonomous Revenue Cycle Management & Medical Billing
- Figure 4: Market Dynamics — Drivers, Restraints and Opportunities — Autonomous Revenue Cycle Management & Medical Billing
- Figure 5: Segment Contribution Analysis — Autonomous Revenue Cycle Management & Medical Billing
- Figure 6: Regional Market Landscape — Autonomous Revenue Cycle Management & Medical Billing
- Figure 7: Country-level Opportunity Mapping — Autonomous Revenue Cycle Management & Medical Billing
- Figure 8: Competitive Positioning Matrix — Autonomous Revenue Cycle Management & Medical Billing
- Figure 9: Market Share of Leading Players — Autonomous Revenue Cycle Management & Medical Billing
- Figure 10: Adoption and Penetration Trends — Autonomous Revenue Cycle Management & Medical Billing
- Figure 11: Technology and Innovation Landscape — Autonomous Revenue Cycle Management & Medical Billing
- Figure 12: Pricing and Business Model Analysis — Autonomous Revenue Cycle Management & Medical Billing
- Figure 13: Investment, Funding and M&A Landscape — Autonomous Revenue Cycle Management & Medical Billing
- Figure 14: Regulatory and Policy Framework — Autonomous Revenue Cycle Management & Medical Billing
- Figure 15: Porter's Five Forces Analysis — Autonomous Revenue Cycle Management & Medical Billing
- Figure 16: PESTLE Analysis — Autonomous Revenue Cycle Management & Medical Billing
- Figure 17: Growth Opportunity Heat Map — Autonomous Revenue Cycle Management & Medical Billing
- Figure 18: Future Outlook and Strategic Roadmap — Autonomous Revenue Cycle Management & Medical Billing
List of Tables
- Table 1: Market Segmentation Overview — Autonomous Revenue Cycle Management & Medical Billing
- Table 2: Segment Definitions and Scope — Autonomous Revenue Cycle Management & Medical Billing
- Table 3: Regional and Country Coverage Summary — Autonomous Revenue Cycle Management & Medical Billing
- Table 4: Key Company Profiles and Offerings — Autonomous Revenue Cycle Management & Medical Billing
- Table 5: Competitive Benchmarking Matrix — Autonomous Revenue Cycle Management & Medical Billing
- Table 6: Product and Service Portfolio Mapping — Autonomous Revenue Cycle Management & Medical Billing
- Table 7: Market Drivers, Restraints and Trends — Autonomous Revenue Cycle Management & Medical Billing
- Table 8: Strategic Initiatives and Developments — Autonomous Revenue Cycle Management & Medical Billing
- Table 9: Partnerships and Collaborations — Autonomous Revenue Cycle Management & Medical Billing
- Table 10: Research Assumptions and Limitations — Autonomous Revenue Cycle Management & Medical Billing
- Table 11: Data Sources and References — Autonomous Revenue Cycle Management & Medical Billing
- Table 12: Report Scope and Coverage Summary — Autonomous Revenue Cycle Management & Medical Billing
A look at the pages.
107 pages · 20 sections · charts & tables
A genuine peek at the opening pages. Unlock to read every page in full.
6 of 107 pages shown
Turn this market into a plan for your business.
Answer a few quick questions and unlock a personalised operational read — your maturity score, prioritised focus areas and quick wins — mapped to where this market is heading. Result delivered instantly and emailed to you.
- Maturity score & prioritised focus areas
- Practical quick wins and a recommended next step
Questions, answered.
How big is the Global Autonomous Revenue Cycle Management & Medical Billing Market?
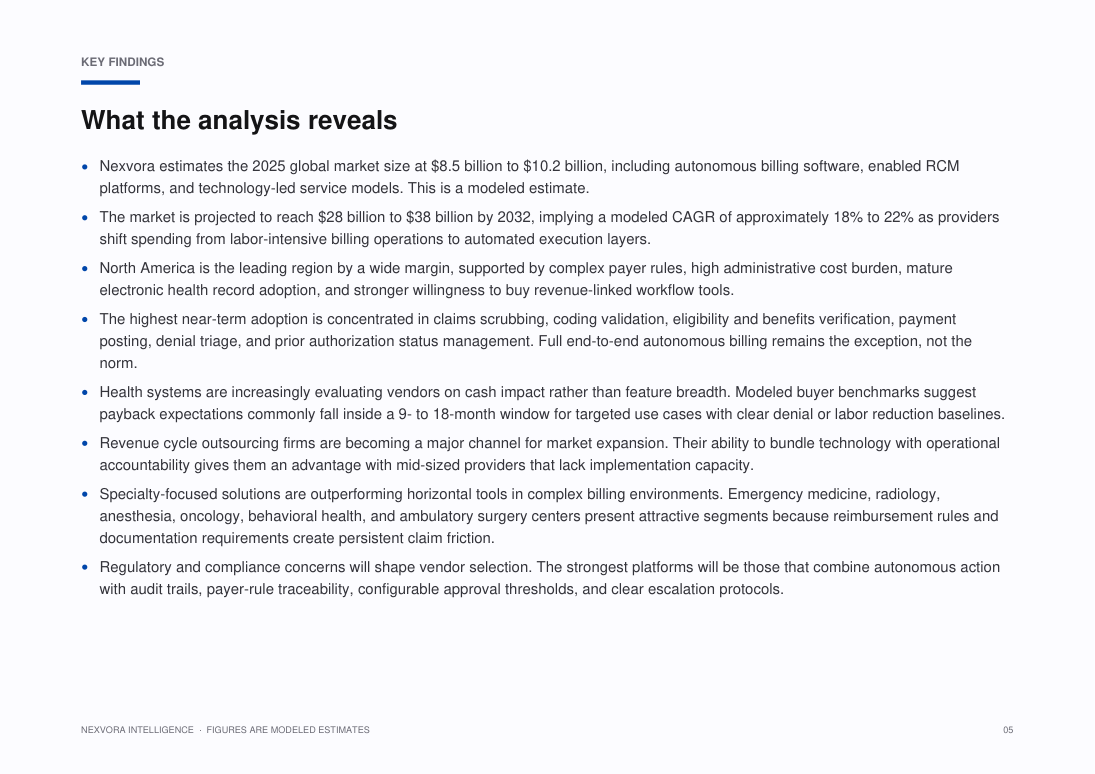
Nexvora models the Global Autonomous Revenue Cycle Management & Medical Billing Market at approximately $8.5B–$10.2B, 2025E. Full market sizing, segmentation and forecasts are inside the report (modeled estimate).
What is the growth rate (CAGR) of the Global Autonomous Revenue Cycle Management & Medical Billing Market?
The Global Autonomous Revenue Cycle Management & Medical Billing Market is projected to grow at a CAGR of about 18%–22%, 2025–2032E over the forecast period — a Nexvora modeled estimate detailed across the report's 20 sections.
What does this report include?
A complete market intelligence report — market sizing and forecasts, segmentation, regional and industry analysis, competitive landscape, trends, and strategic recommendations across 20 sections.
How do I access it after purchase?
Instantly, in your secure online viewer. Reports are view-only and available on any device from your library.
Are the figures sourced?
Quantitative figures are Nexvora modeled estimates unless explicitly cited to a referenced source within the report.
Can I buy access for my team?
Yes — add user seats at checkout, or subscribe for bulk access across multiple reports.
Nexvora Intelligence research report. All quantitative figures are modeled estimates — not audited data. Not financial or investment advice.
Clinical Trial Management Software vs Pharmaceutical Contract Manufacturing
The right choice depends on the buyer’s priorities because these offerings serve different healthcare and life sciences needs. Choose Lonza’s Pharmaceutical Contract Manufacturing if you need pharmaceutical contract development and manufacturing services for biologics, small molecules, or selected advanced therapy manufacturing. Choose Oracle’s Clinical Trial Management Software if your priority is software for clinical trial operations.
Grounded in published specifications — guidance, not an endorsement.
More market reports
Keep exploring intelligence in this and related sectors.

Global Radiopharmaceutical Theranostics & Alpha-Emitter Oncology Market — Intelligence Report

Global Ambient Clinical Documentation & Medical Scribes Market — Intelligence Report

Global GLP-1 Obesity Therapeutics & Metabolic Health Platforms Market — Intelligence Report
Global Radiopharmaceutical Theranostics & Targeted Alpha Therapy Market — Intelligence Report
AI Analyst
Insights and answers generated live from Global Autonomous Revenue Cycle Management & Medical Billing Market — Intelligence Report's verified data. Modeled estimates — not investment advice.
Not enough data yet to generate insights.