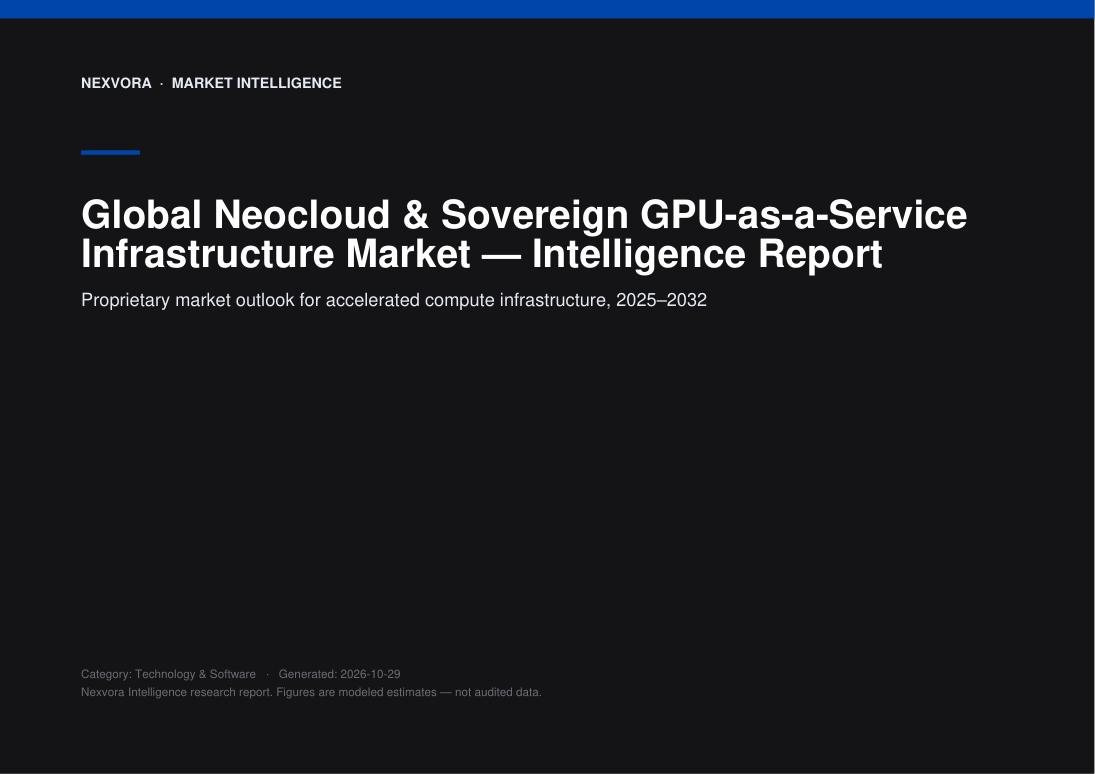
Global Neocloud & Sovereign GPU-as-a-Service Infrastructure Market — Intelligence Report
Proprietary market outlook for accelerated compute infrastructure, 2025–2032
Nexvora Intelligence market report on Global AI Neocloud & Sovereign GPU-as-a-Service Infrastructure Market.
per extra user
Instant access after payment. Secure via Razorpay.
The opening view — free.
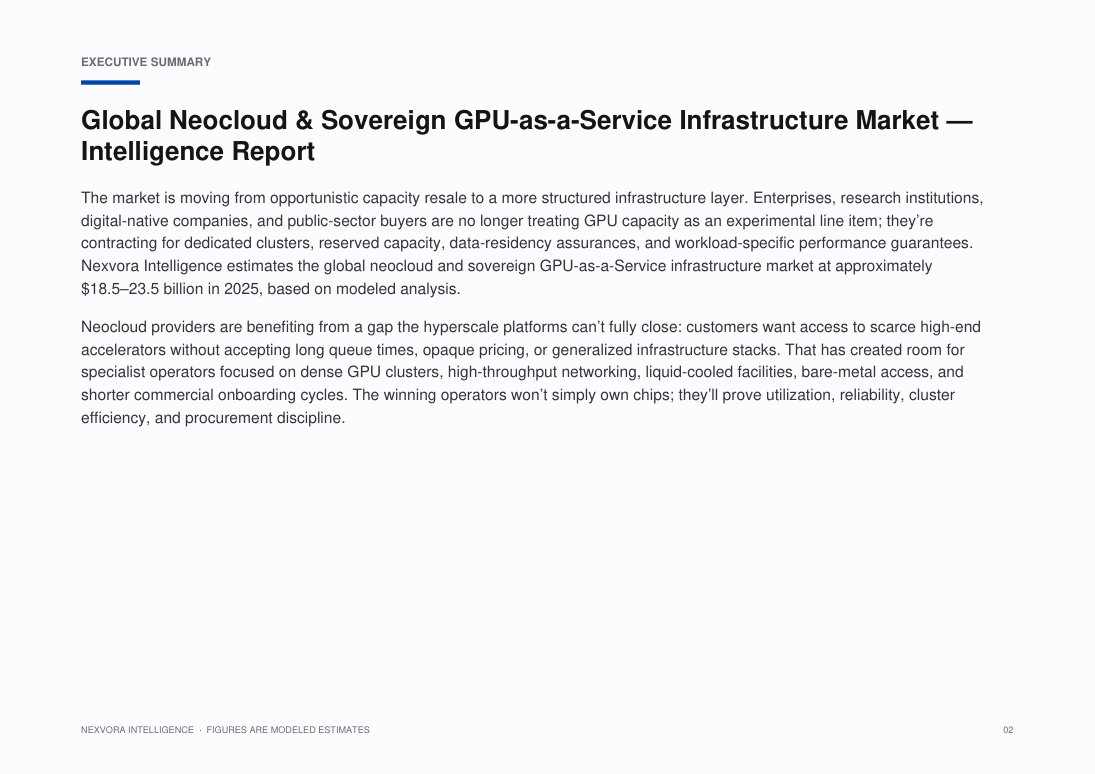
The market is moving from opportunistic capacity resale to a more structured infrastructure layer. Enterprises, research institutions, digital-native companies, and public-sector buyers are no longer treating GPU capacity as an experimental line item; they’re contracting for dedicated clusters, reserved capacity, data-residency assurances, and workload-specific performance guarantees. Nexvora Intelligence estimates the global neocloud and sovereign GPU-as-a-Service infrastructure market at approximately $•••–••• billion in 2025, based on modeled analysis.
Neocloud providers are benefiting from a gap the hyperscale platforms can’t fully close: customers want access to scarce high-end accelerators without accepting long queue times, opaque pricing, or generalized infrastructure stacks. That has created room for specialist operators focused on dense GPU clusters, high-throughput networking, liquid-cooled facilities, bare-metal access, and shorter commercial onboarding cycles. The winning operators won’t simply own chips; they’ll prove utilization, reliability, cluster efficiency, and procurement discipline.
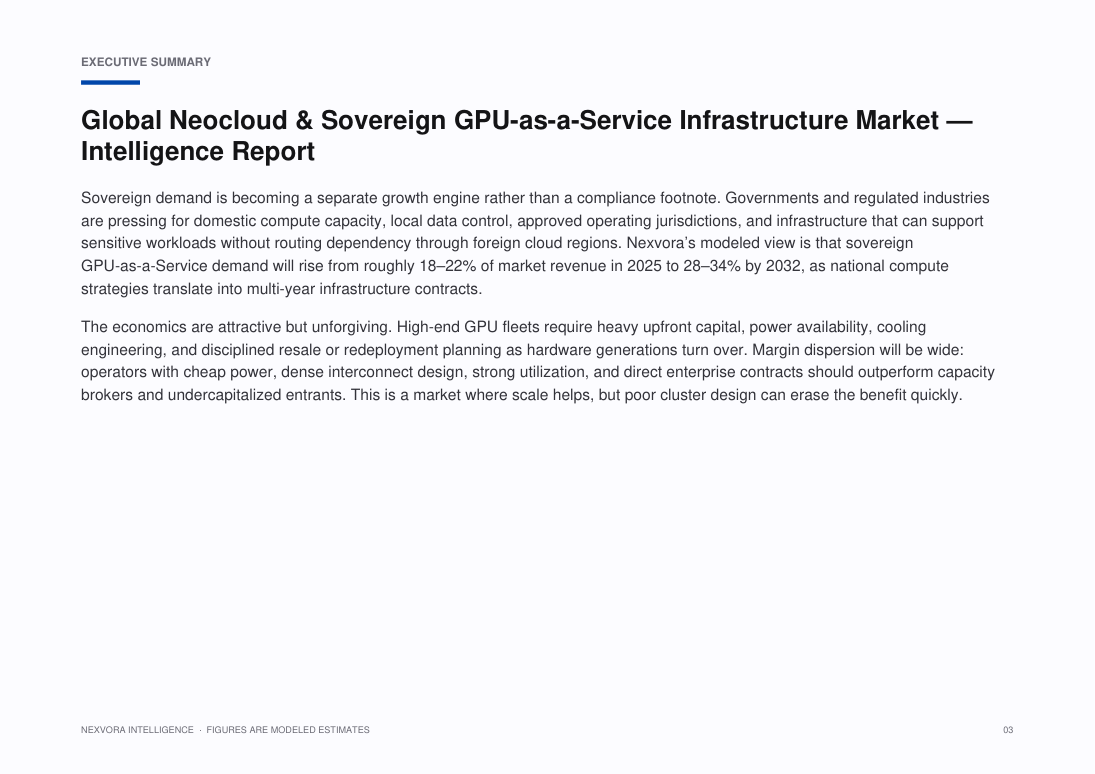
Sovereign demand is becoming a separate growth engine rather than a compliance footnote. Governments and regulated industries are pressing for domestic compute capacity, local data control, approved operating jurisdictions, and infrastructure that can support sensitive workloads without routing dependency through foreign cloud regions. Nexvora’s modeled view is that sovereign GPU-as-a-Service demand will rise from roughly 18–••% of market revenue in 2025 to 28–••% by 2032, as national compute strategies translate into multi-year infrastructure contracts.
The economics are attractive but unforgiving. High-end GPU fleets require heavy upfront capital, power availability, cooling engineering, and disciplined resale or redeployment planning as hardware generations turn over. Margin dispersion will be wide: operators with cheap power, dense interconnect design, strong utilization, and direct enterprise contracts should outperform capacity brokers and undercapitalized entrants. This is a market where scale helps, but poor cluster design can erase the benefit quickly.
Specific figures are hidden in this free preview. Unlock the report to see all modeled market sizes, forecasts and growth rates.
What this report covers.
Proprietary market outlook for accelerated compute infrastructure, 2025–2032
Who this report is for.
- Corporate strategy, planning and M&A teams evaluating the market
- Investors, private equity and venture teams sizing the opportunity
- Product, marketing and go-to-market leaders
- Consultants and analysts building the competitive picture
- Executives planning market entry, expansion or investment
How this report is built.
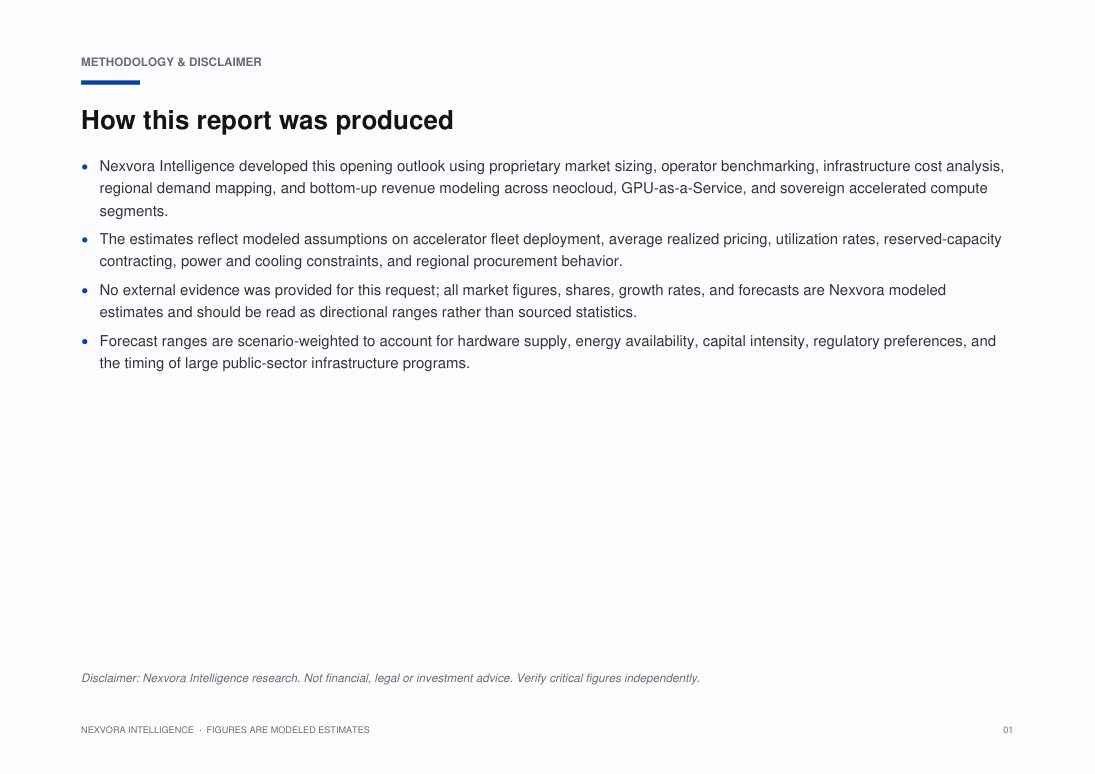
Nexvora Intelligence developed this opening outlook using proprietary market sizing, operator benchmarking, infrastructure cost analysis, regional demand mapping, and bottom-up revenue modeling across neocloud, GPU-as-a-Service, and sovereign accelerated compute segments.
The estimates reflect modeled assumptions on accelerator fleet deployment, average realized pricing, utilization rates, reserved-capacity contracting, power and cooling constraints, and regional procurement behavior.
No external evidence was provided for this request; all market figures, shares, growth rates, and forecasts are Nexvora modeled estimates and should be read as directional ranges rather than sourced statistics.
Forecast ranges are scenario-weighted to account for hardware supply, energy availability, capital intensity, regulatory preferences, and the timing of large public-sector infrastructure programs.
What's inside — a number-free look.
A full outline of the figures and tables you'll get. Specific data, market sizes and forecasts are unlocked with purchase.
List of Figures
- Figure 1: Market Overview and Structure — Neocloud & Sovereign GPU-as-a-Service Infrastructure
- Figure 2: Market Size and Forecast Framework — Neocloud & Sovereign GPU-as-a-Service Infrastructure
- Figure 3: Value Chain and Ecosystem Analysis — Neocloud & Sovereign GPU-as-a-Service Infrastructure
- Figure 4: Market Dynamics — Drivers, Restraints and Opportunities — Neocloud & Sovereign GPU-as-a-Service Infrastructure
- Figure 5: Segment Contribution Analysis — Neocloud & Sovereign GPU-as-a-Service Infrastructure
- Figure 6: Regional Market Landscape — Neocloud & Sovereign GPU-as-a-Service Infrastructure
- Figure 7: Country-level Opportunity Mapping — Neocloud & Sovereign GPU-as-a-Service Infrastructure
- Figure 8: Competitive Positioning Matrix — Neocloud & Sovereign GPU-as-a-Service Infrastructure
- Figure 9: Market Share of Leading Players — Neocloud & Sovereign GPU-as-a-Service Infrastructure
- Figure 10: Adoption and Penetration Trends — Neocloud & Sovereign GPU-as-a-Service Infrastructure
- Figure 11: Technology and Innovation Landscape — Neocloud & Sovereign GPU-as-a-Service Infrastructure
- Figure 12: Pricing and Business Model Analysis — Neocloud & Sovereign GPU-as-a-Service Infrastructure
- Figure 13: Investment, Funding and M&A Landscape — Neocloud & Sovereign GPU-as-a-Service Infrastructure
- Figure 14: Regulatory and Policy Framework — Neocloud & Sovereign GPU-as-a-Service Infrastructure
- Figure 15: Porter's Five Forces Analysis — Neocloud & Sovereign GPU-as-a-Service Infrastructure
- Figure 16: PESTLE Analysis — Neocloud & Sovereign GPU-as-a-Service Infrastructure
- Figure 17: Growth Opportunity Heat Map — Neocloud & Sovereign GPU-as-a-Service Infrastructure
- Figure 18: Future Outlook and Strategic Roadmap — Neocloud & Sovereign GPU-as-a-Service Infrastructure
List of Tables
- Table 1: Market Segmentation Overview — Neocloud & Sovereign GPU-as-a-Service Infrastructure
- Table 2: Segment Definitions and Scope — Neocloud & Sovereign GPU-as-a-Service Infrastructure
- Table 3: Regional and Country Coverage Summary — Neocloud & Sovereign GPU-as-a-Service Infrastructure
- Table 4: Key Company Profiles and Offerings — Neocloud & Sovereign GPU-as-a-Service Infrastructure
- Table 5: Competitive Benchmarking Matrix — Neocloud & Sovereign GPU-as-a-Service Infrastructure
- Table 6: Product and Service Portfolio Mapping — Neocloud & Sovereign GPU-as-a-Service Infrastructure
- Table 7: Market Drivers, Restraints and Trends — Neocloud & Sovereign GPU-as-a-Service Infrastructure
- Table 8: Strategic Initiatives and Developments — Neocloud & Sovereign GPU-as-a-Service Infrastructure
- Table 9: Partnerships and Collaborations — Neocloud & Sovereign GPU-as-a-Service Infrastructure
- Table 10: Research Assumptions and Limitations — Neocloud & Sovereign GPU-as-a-Service Infrastructure
- Table 11: Data Sources and References — Neocloud & Sovereign GPU-as-a-Service Infrastructure
- Table 12: Report Scope and Coverage Summary — Neocloud & Sovereign GPU-as-a-Service Infrastructure
A look at the pages.
107 pages · 20 sections · charts & tables
A genuine peek at the opening pages. Unlock to read every page in full.
6 of 107 pages shown
Turn this market into a plan for your business.
Answer a few quick questions and unlock a personalised operational read — your maturity score, prioritised focus areas and quick wins — mapped to where this market is heading. Result delivered instantly and emailed to you.
- Maturity score & prioritised focus areas
- Practical quick wins and a recommended next step
Questions, answered.
How big is the Global Neocloud & Sovereign GPU-as-a-Service Infrastructure Market?
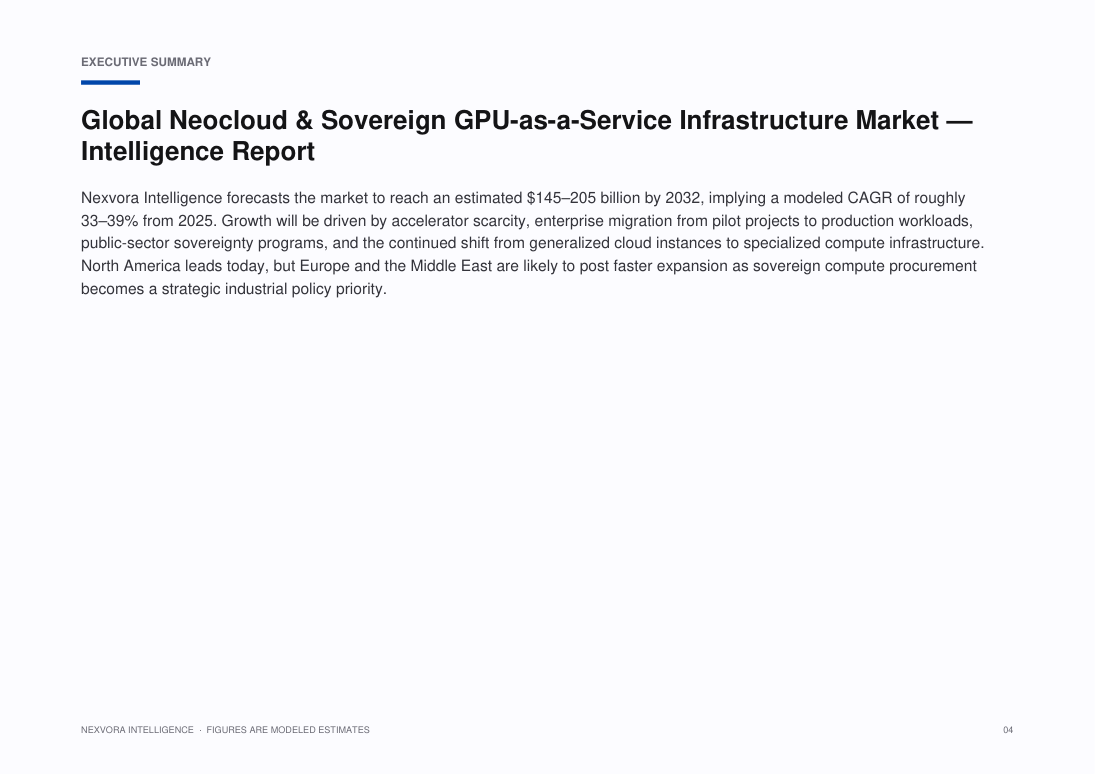
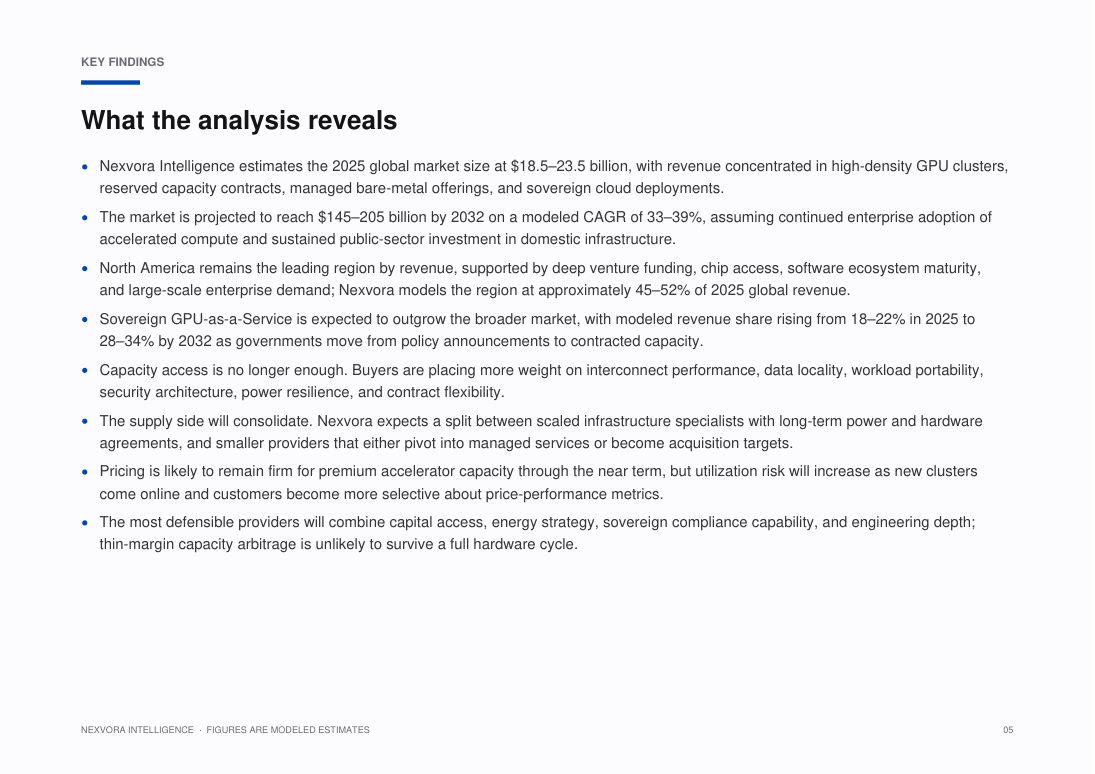
Nexvora models the Global Neocloud & Sovereign GPU-as-a-Service Infrastructure Market at approximately $18.5–23.5B. Full market sizing, segmentation and forecasts are inside the report (modeled estimate).
What is the growth rate (CAGR) of the Global Neocloud & Sovereign GPU-as-a-Service Infrastructure Market?
The Global Neocloud & Sovereign GPU-as-a-Service Infrastructure Market is projected to grow at a CAGR of about 33–39% over the forecast period — a Nexvora modeled estimate detailed across the report's 20 sections.
What does this report include?
A complete market intelligence report — market sizing and forecasts, segmentation, regional and industry analysis, competitive landscape, trends, and strategic recommendations across 20 sections.
How do I access it after purchase?
Instantly, in your secure online viewer. Reports are view-only and available on any device from your library.
Are the figures sourced?
Quantitative figures are Nexvora modeled estimates unless explicitly cited to a referenced source within the report.
Can I buy access for my team?
Yes — add user seats at checkout, or subscribe for bulk access across multiple reports.
Nexvora Intelligence research report. All quantitative figures are modeled estimates — not audited data. Not financial or investment advice.
Cloud Infrastructure Services vs Microsoft Azure
Choose Cloud Infrastructure Services if you need a public cloud offering from Amazon Web Services with disclosed IaaS and PaaS service models and management through the AWS Management Console, AWS CLI, SDKs, and APIs. Choose Microsoft Azure if you need a Microsoft cloud services platform that explicitly supports public cloud, hybrid cloud, and multi-cloud management scenarios with usage-based pricing. The right choice depends on whether your priority is the disclosed AWS service model and interfaces or Azure’s stated deployment flexibility and pricing model.
Grounded in published specifications — guidance, not an endorsement.
More market reports
Keep exploring intelligence in this and related sectors.
Global Autonomous Security Operations & SOC Platforms Market — Intelligence Report
Global Co-Packaged Optics, 1.6T Transceivers & Optical Interconnects for Accelerated Data Centers — Intelligence Report
Global Sovereign Accelerated Cloud & GPU-as-a-Service Platforms Market — Intelligence Report
Global Software Development Agents & Coding Automation Platforms Market — Intelligence Report
AI Analyst
Insights and answers generated live from Global Neocloud & Sovereign GPU-as-a-Service Infrastructure Market — Intelligence Report's verified data. Modeled estimates — not investment advice.
- The report covers the Global Neocloud & Sovereign GPU-as-a-Service Infrastructure Market.
- The sector identified for the report is Technology & Software.
- The subtitle positions the report as a proprietary market outlook for accelerated compute infrastructure for 2025–2032.
- Notable: The report focuses on AI Neocloud and Sovereign GPU-as-a-Service infrastructure, according to Nexvora Intelligence.