
Global Intelligent Revenue Cycle Management, Prior Authorization and Claims Automation Market — Intelligence Report
Strategic market outlook for healthcare administrative workflow transformation, 2025–2032
Nexvora Intelligence market report on Global AI-Native Revenue Cycle Management, Prior Authorization and Claims Automation Market.

per extra user
Instant access after payment. Secure via Razorpay.
The opening view — free.
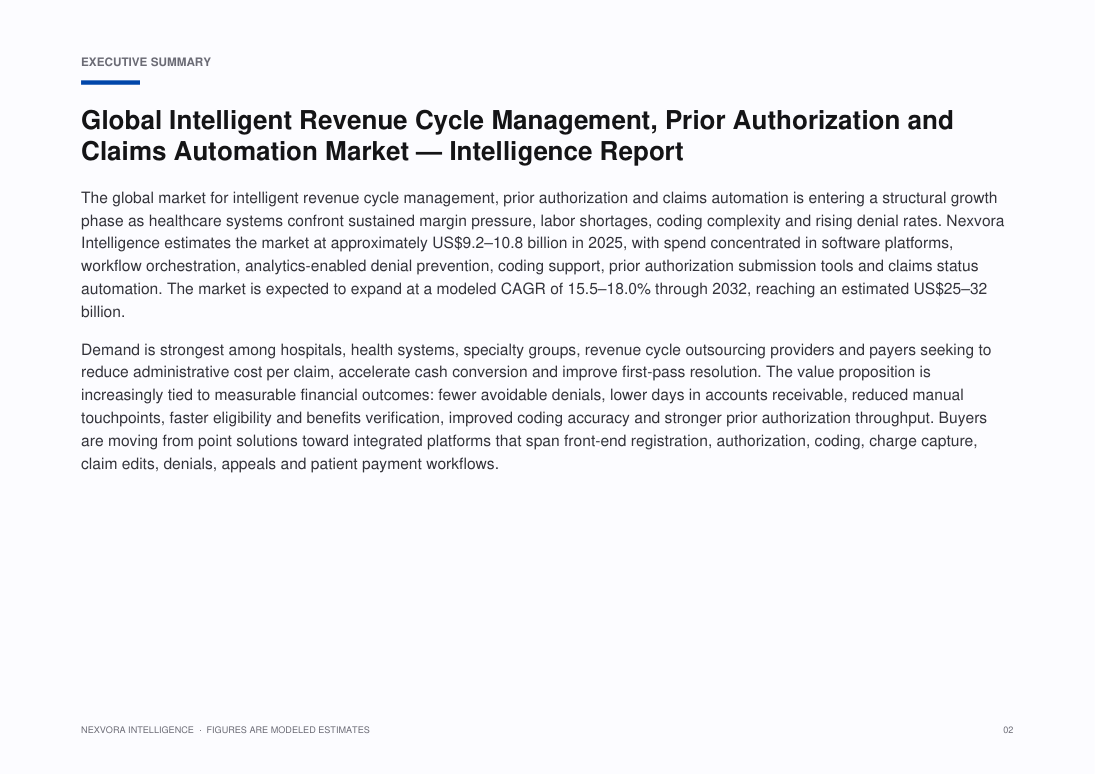
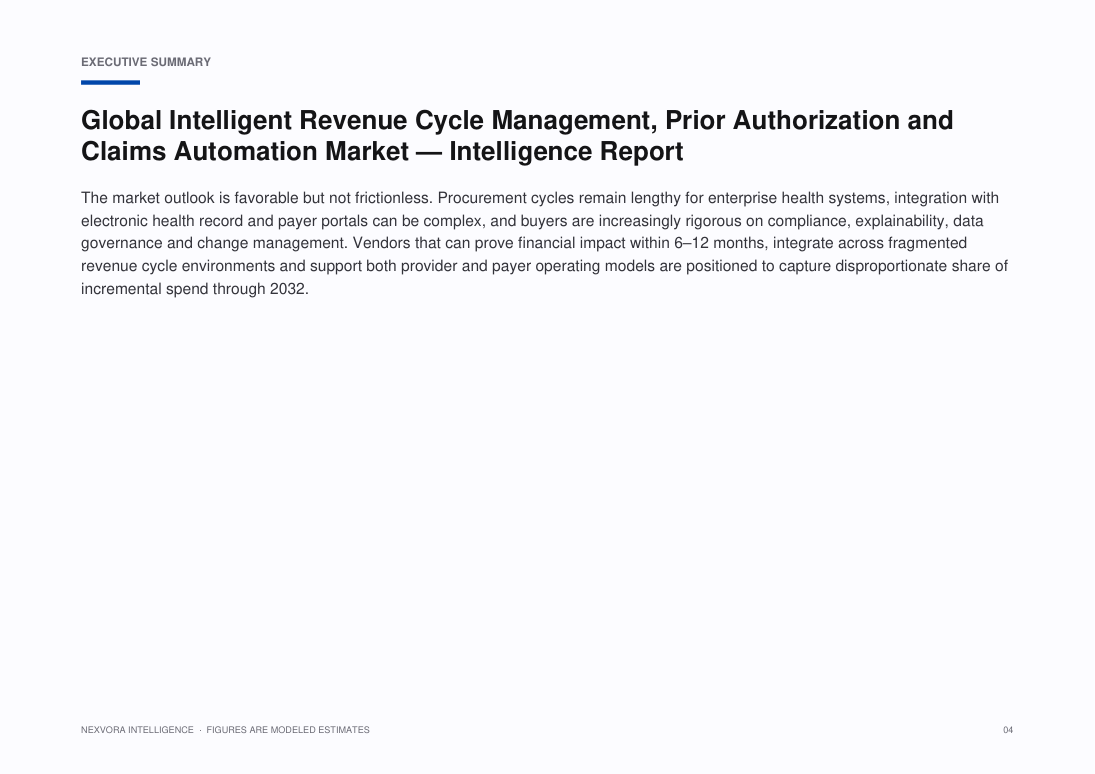
The global market for intelligent revenue cycle management, prior authorization and claims automation is entering a structural growth phase as healthcare systems confront sustained margin pressure, labor shortages, coding complexity and rising denial rates. Nexvora Intelligence estimates the market at approximately US$•••–••• billion in 2025, with spend concentrated in software platforms, workflow orchestration, analytics-enabled denial prevention, coding support, prior authorization submission tools and claims status automation. The market is expected to expand at a modeled CAGR of 15.5–••% through 2032, reaching an estimated US$•••–••• billion.
Demand is strongest among hospitals, health systems, specialty groups, revenue cycle outsourcing providers and payers seeking to reduce administrative cost per claim, accelerate cash conversion and improve first-pass resolution. The value proposition is increasingly tied to measurable financial outcomes: fewer avoidable denials, lower days in accounts receivable, reduced manual touchpoints, faster eligibility and benefits verification, improved coding accuracy and stronger prior authorization throughput. Buyers are moving from point solutions toward integrated platforms that span front-end registration, authorization, coding, charge capture, claim edits, denials, appeals and patient payment workflows.
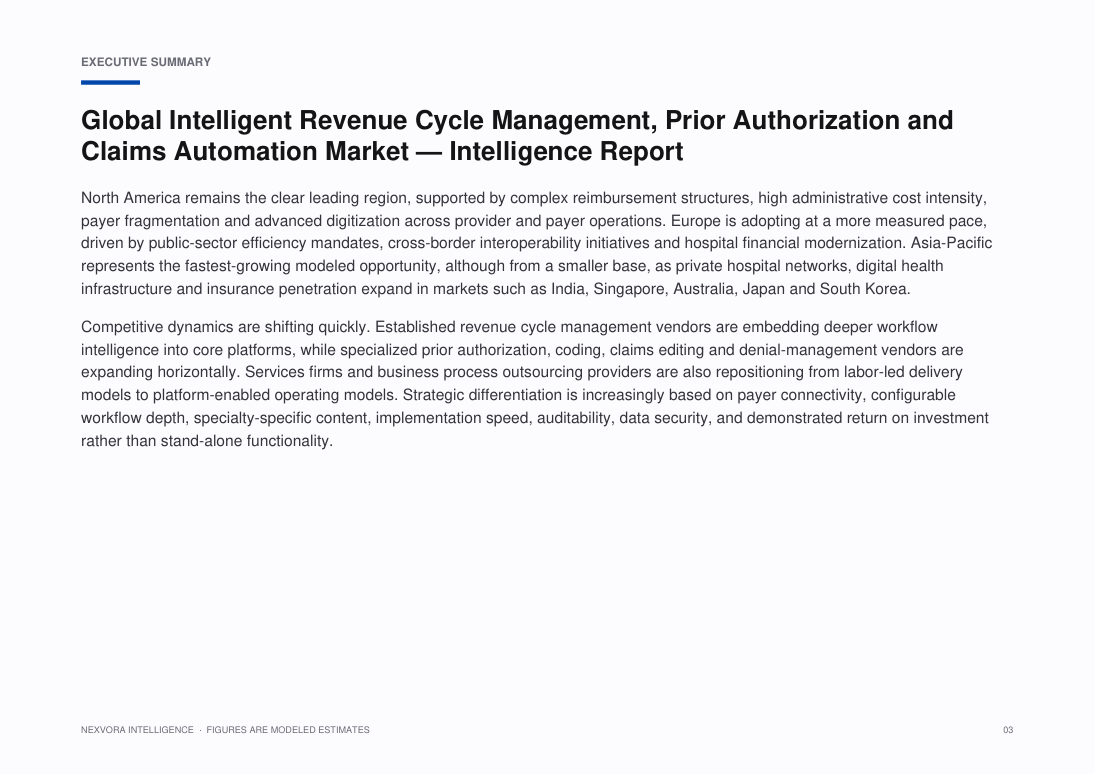
North America remains the clear leading region, supported by complex reimbursement structures, high administrative cost intensity, payer fragmentation and advanced digitization across provider and payer operations. Europe is adopting at a more measured pace, driven by public-sector efficiency mandates, cross-border interoperability initiatives and hospital financial modernization. Asia-Pacific represents the fastest-growing modeled opportunity, although from a smaller base, as private hospital networks, digital health infrastructure and insurance penetration expand in markets such as India, Singapore, Australia, Japan and South Korea.
Competitive dynamics are shifting quickly. Established revenue cycle management vendors are embedding deeper workflow intelligence into core platforms, while specialized prior authorization, coding, claims editing and denial-management vendors are expanding horizontally. Services firms and business process outsourcing providers are also repositioning from labor-led delivery models to platform-enabled operating models. Strategic differentiation is increasingly based on payer connectivity, configurable workflow depth, specialty-specific content, implementation speed, auditability, data security, and demonstrated return on investment rather than stand-alone functionality.
Specific figures are hidden in this free preview. Unlock the report to see all modeled market sizes, forecasts and growth rates.
What this report covers.
Strategic market outlook for healthcare administrative workflow transformation, 2025–2032
Who this report is for.
- Corporate strategy, planning and M&A teams evaluating the market
- Investors, private equity and venture teams sizing the opportunity
- Product, marketing and go-to-market leaders
- Consultants and analysts building the competitive picture
- Executives planning market entry, expansion or investment
How this report is built.
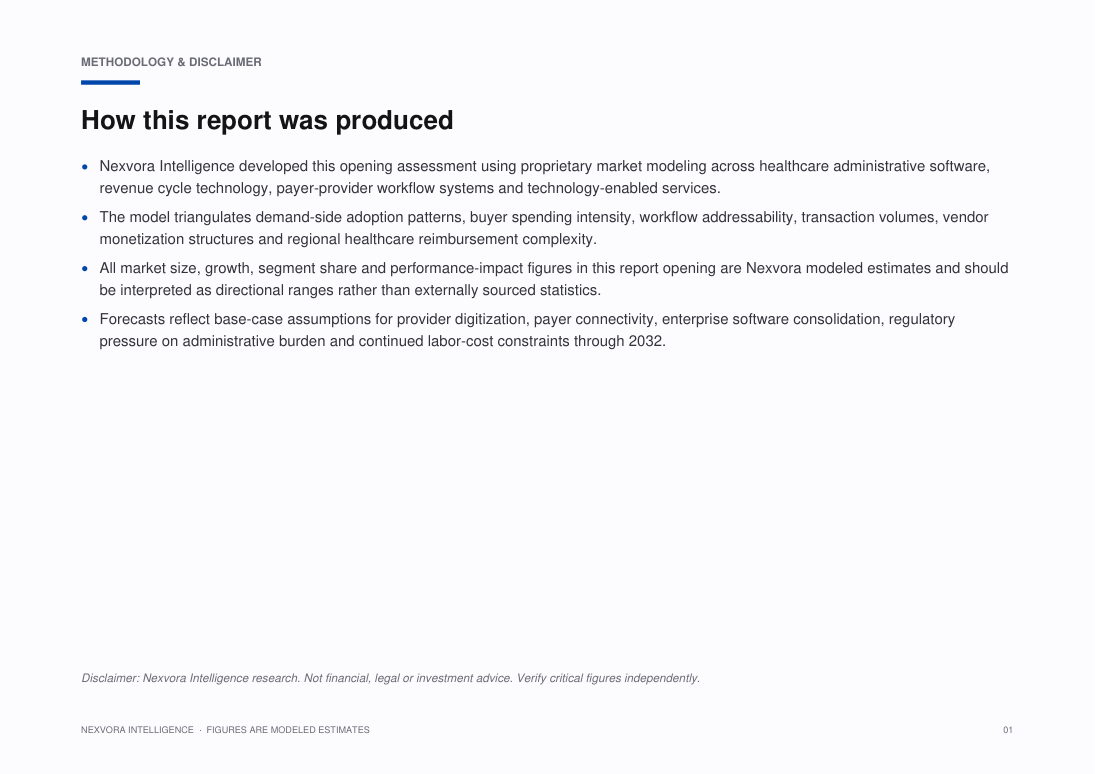
Nexvora Intelligence developed this opening assessment using proprietary market modeling across healthcare administrative software, revenue cycle technology, payer-provider workflow systems and technology-enabled services.
The model triangulates demand-side adoption patterns, buyer spending intensity, workflow addressability, transaction volumes, vendor monetization structures and regional healthcare reimbursement complexity.
All market size, growth, segment share and performance-impact figures in this report opening are Nexvora modeled estimates and should be interpreted as directional ranges rather than externally sourced statistics.
Forecasts reflect base-case assumptions for provider digitization, payer connectivity, enterprise software consolidation, regulatory pressure on administrative burden and continued labor-cost constraints through 2032.
What's inside — a number-free look.
A full outline of the figures and tables you'll get. Specific data, market sizes and forecasts are unlocked with purchase.
List of Figures
- Figure 1: Market Overview and Structure — Intelligent Revenue Cycle Management, Prior Authorization and Claims Automation
- Figure 2: Market Size and Forecast Framework — Intelligent Revenue Cycle Management, Prior Authorization and Claims Automation
- Figure 3: Value Chain and Ecosystem Analysis — Intelligent Revenue Cycle Management, Prior Authorization and Claims Automation
- Figure 4: Market Dynamics — Drivers, Restraints and Opportunities — Intelligent Revenue Cycle Management, Prior Authorization and Claims Automation
- Figure 5: Segment Contribution Analysis — Intelligent Revenue Cycle Management, Prior Authorization and Claims Automation
- Figure 6: Regional Market Landscape — Intelligent Revenue Cycle Management, Prior Authorization and Claims Automation
- Figure 7: Country-level Opportunity Mapping — Intelligent Revenue Cycle Management, Prior Authorization and Claims Automation
- Figure 8: Competitive Positioning Matrix — Intelligent Revenue Cycle Management, Prior Authorization and Claims Automation
- Figure 9: Market Share of Leading Players — Intelligent Revenue Cycle Management, Prior Authorization and Claims Automation
- Figure 10: Adoption and Penetration Trends — Intelligent Revenue Cycle Management, Prior Authorization and Claims Automation
- Figure 11: Technology and Innovation Landscape — Intelligent Revenue Cycle Management, Prior Authorization and Claims Automation
- Figure 12: Pricing and Business Model Analysis — Intelligent Revenue Cycle Management, Prior Authorization and Claims Automation
- Figure 13: Investment, Funding and M&A Landscape — Intelligent Revenue Cycle Management, Prior Authorization and Claims Automation
- Figure 14: Regulatory and Policy Framework — Intelligent Revenue Cycle Management, Prior Authorization and Claims Automation
- Figure 15: Porter's Five Forces Analysis — Intelligent Revenue Cycle Management, Prior Authorization and Claims Automation
- Figure 16: PESTLE Analysis — Intelligent Revenue Cycle Management, Prior Authorization and Claims Automation
- Figure 17: Growth Opportunity Heat Map — Intelligent Revenue Cycle Management, Prior Authorization and Claims Automation
- Figure 18: Future Outlook and Strategic Roadmap — Intelligent Revenue Cycle Management, Prior Authorization and Claims Automation
List of Tables
- Table 1: Market Segmentation Overview — Intelligent Revenue Cycle Management, Prior Authorization and Claims Automation
- Table 2: Segment Definitions and Scope — Intelligent Revenue Cycle Management, Prior Authorization and Claims Automation
- Table 3: Regional and Country Coverage Summary — Intelligent Revenue Cycle Management, Prior Authorization and Claims Automation
- Table 4: Key Company Profiles and Offerings — Intelligent Revenue Cycle Management, Prior Authorization and Claims Automation
- Table 5: Competitive Benchmarking Matrix — Intelligent Revenue Cycle Management, Prior Authorization and Claims Automation
- Table 6: Product and Service Portfolio Mapping — Intelligent Revenue Cycle Management, Prior Authorization and Claims Automation
- Table 7: Market Drivers, Restraints and Trends — Intelligent Revenue Cycle Management, Prior Authorization and Claims Automation
- Table 8: Strategic Initiatives and Developments — Intelligent Revenue Cycle Management, Prior Authorization and Claims Automation
- Table 9: Partnerships and Collaborations — Intelligent Revenue Cycle Management, Prior Authorization and Claims Automation
- Table 10: Research Assumptions and Limitations — Intelligent Revenue Cycle Management, Prior Authorization and Claims Automation
- Table 11: Data Sources and References — Intelligent Revenue Cycle Management, Prior Authorization and Claims Automation
- Table 12: Report Scope and Coverage Summary — Intelligent Revenue Cycle Management, Prior Authorization and Claims Automation
A look at the pages.
107 pages · 20 sections · charts & tables
A genuine peek at the opening pages. Unlock to read every page in full.
6 of 107 pages shown
Turn this market into a plan for your business.
Answer a few quick questions and unlock a personalised operational read — your maturity score, prioritised focus areas and quick wins — mapped to where this market is heading. Result delivered instantly and emailed to you.
- Maturity score & prioritised focus areas
- Practical quick wins and a recommended next step
Questions, answered.
How big is the Global Intelligent Revenue Cycle Management, Prior Authorization and Claims Automation Market?
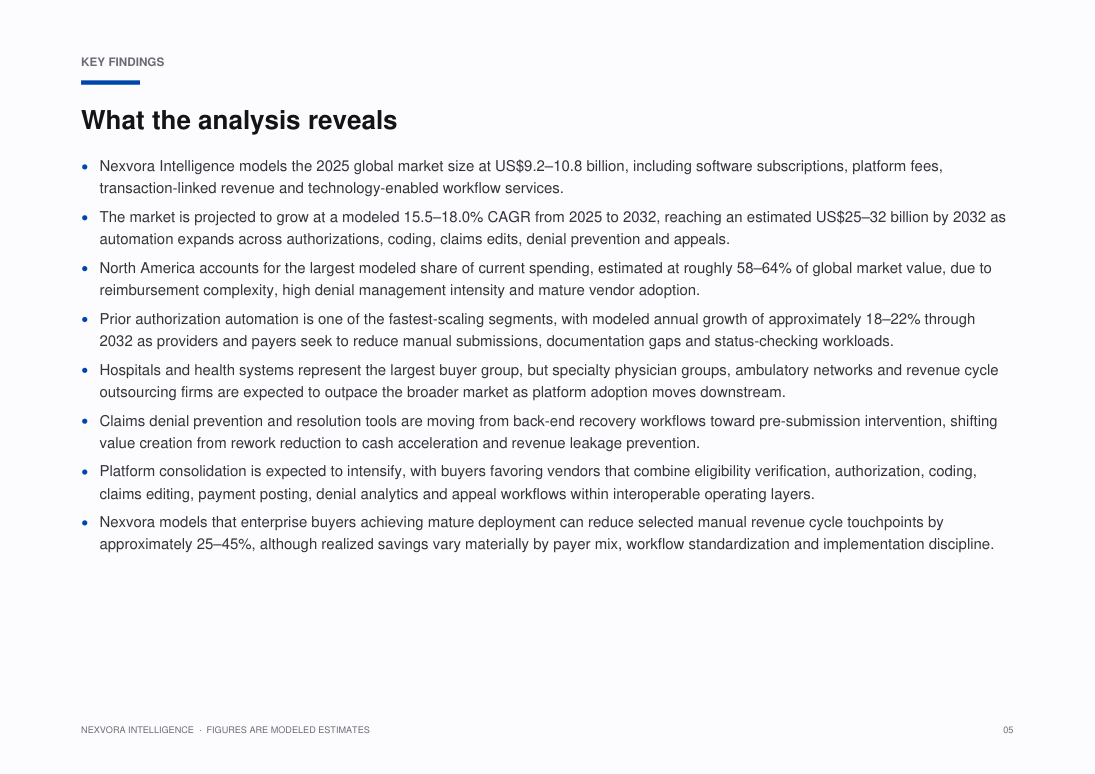
Nexvora models the Global Intelligent Revenue Cycle Management, Prior Authorization and Claims Automation Market at approximately US$9.2–10.8B, 2025E. Full market sizing, segmentation and forecasts are inside the report (modeled estimate).
What is the growth rate (CAGR) of the Global Intelligent Revenue Cycle Management, Prior Authorization and Claims Automation Market?
The Global Intelligent Revenue Cycle Management, Prior Authorization and Claims Automation Market is projected to grow at a CAGR of about 15.5–18.0%, 2025–2032 over the forecast period — a Nexvora modeled estimate detailed across the report's 20 sections.
What does this report include?
A complete market intelligence report — market sizing and forecasts, segmentation, regional and industry analysis, competitive landscape, trends, and strategic recommendations across 20 sections.
How do I access it after purchase?
Instantly, in your secure online viewer. Reports are view-only and available on any device from your library.
Are the figures sourced?
Quantitative figures are Nexvora modeled estimates unless explicitly cited to a referenced source within the report.
Can I buy access for my team?
Yes — add user seats at checkout, or subscribe for bulk access across multiple reports.
Nexvora Intelligence research report. All quantitative figures are modeled estimates — not audited data. Not financial or investment advice.
More market reports
Keep exploring intelligence in this and related sectors.

Global GLP-1 Obesity Therapeutics & Metabolic Health Market — Intelligence Report

Global Revenue Cycle Management, Prior Authorization Automation and Clinical Documentation Platforms Market — Intelligence Report

Global Radiopharmaceutical Theranostics, Alpha-Emitter Oncology and Medical Isotope Supply Chain Market — Intelligence Report