
Global EV Charging Infrastructure Market — Intelligence Report
Strategic market outlook for charging networks, hardware, software, and deployment models, 2025–2035
Charging network build-out, utilisation economics and the policy tailwinds shaping deployment.

per extra user
Instant access after payment. Secure via Razorpay.
The opening view — free.
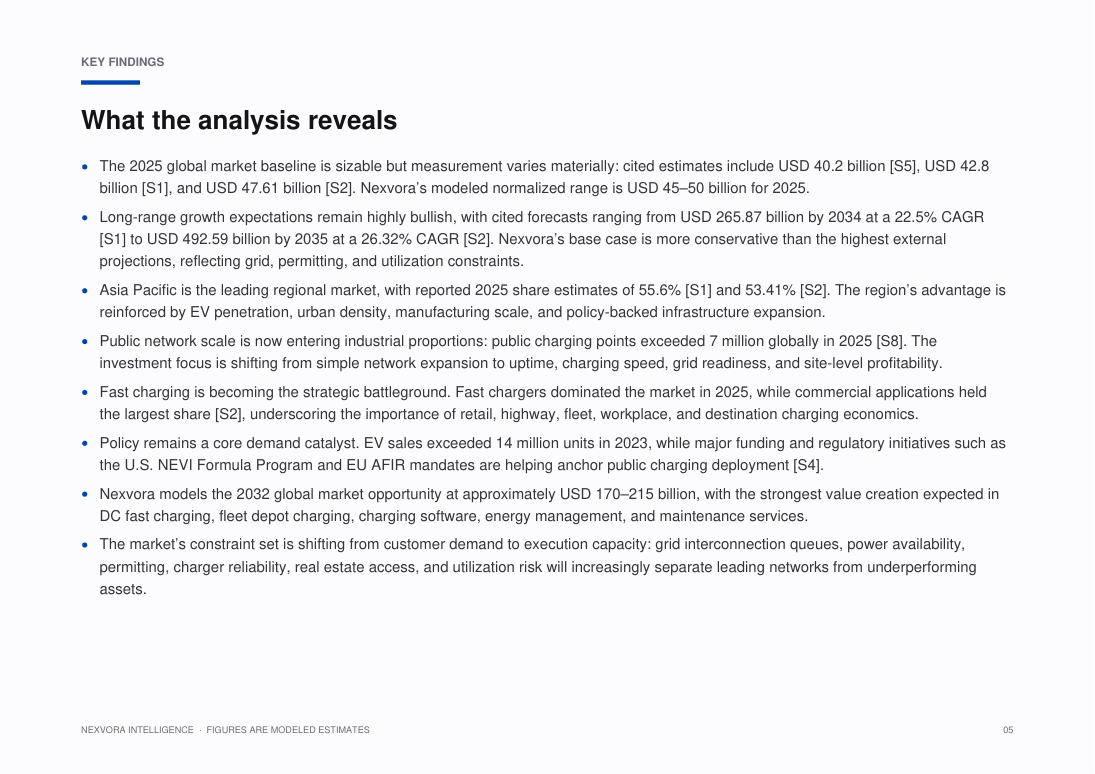
The EV charging infrastructure market has moved from an early deployment cycle into a scale-up phase defined by network density, charging reliability, grid integration, and utilization economics. Published 2025 market estimates cluster across a wide range, including USD ••• billion [S5], USD ••• billion [S1], and USD ••• billion [S2], reflecting differences in scope across charging hardware, installation, software, services, and public versus private infrastructure. Nexvora Intelligence’s modeled view places the 2025 global market at approximately USD 45–••• billion, with materially faster growth in public, commercial, depot, and ultra-fast charging segments than in basic residential charging hardware.
Demand is being structurally pulled by EV parc expansion, regulatory pressure, fleet electrification, and public-private capital deployment. Global EV sales exceeded ••• million units in 2023, while major policy mechanisms such as the U.S. NEVI Formula Program and Europe’s AFIR mandates are accelerating network rollout and corridor coverage [S4]. Public charging infrastructure also continued to scale, with global public charging points reaching more than ••• million in 2025 [S8]. The market’s next phase will be less about charger counts alone and more about uptime, power availability, location quality, charger speed mix, and interoperability.
Asia Pacific remains the market’s center of gravity, supported by high EV adoption, dense urban deployment models, domestic charger manufacturing capacity, and strong policy coordination. External market estimates indicate Asia Pacific held ••% of the EV charging infrastructure market in 2025 [S1], while another source places the region’s 2025 share at ••% [S2]. Nexvora expects Asia Pacific to retain leadership through the forecast period, although North America and Europe are positioned for accelerated growth as highway fast-charging corridors, fleet depots, and grid-upgrade programs move from planning to execution.
The competitive structure is becoming more complex. Hardware suppliers, charging-point operators, utilities, automakers, oil and gas retailers, real estate owners, fleet operators, and software platforms are converging around the same value pools. Fast chargers dominated the market in 2025, while commercial applications represented the largest application segment [S2]. This points to a decisive shift from low-power destination charging toward revenue-generating public, workplace, retail, highway, and fleet charging assets where throughput and utilization determine returns.
Specific figures are hidden in this free preview. Unlock the report to see all modeled market sizes, forecasts and growth rates.
What this report covers.
Strategic market outlook for charging networks, hardware, software, and deployment models, 2025–2035
Who this report is for.
- Corporate strategy, planning and M&A teams evaluating the market
- Investors, private equity and venture teams sizing the opportunity
- Product, marketing and go-to-market leaders
- Consultants and analysts building the competitive picture
- Executives planning market entry, expansion or investment
How this report is built.
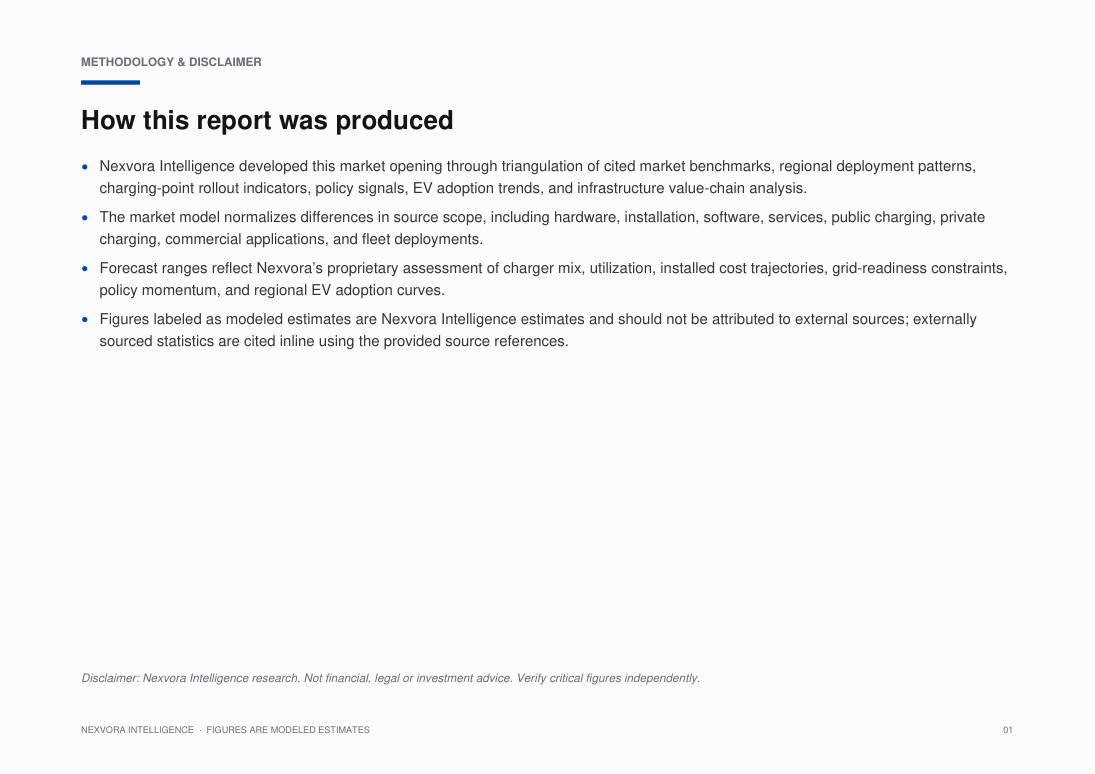
Nexvora Intelligence developed this market opening through triangulation of cited market benchmarks, regional deployment patterns, charging-point rollout indicators, policy signals, EV adoption trends, and infrastructure value-chain analysis.
The market model normalizes differences in source scope, including hardware, installation, software, services, public charging, private charging, commercial applications, and fleet deployments.
Forecast ranges reflect Nexvora’s proprietary assessment of charger mix, utilization, installed cost trajectories, grid-readiness constraints, policy momentum, and regional EV adoption curves.
Figures labeled as modeled estimates are Nexvora Intelligence estimates and should not be attributed to external sources; externally sourced statistics are cited inline using the provided source references.
What's inside — a number-free look.
A full outline of the figures and tables you'll get. Specific data, market sizes and forecasts are unlocked with purchase.
List of Figures
- Figure 1: Market Overview and Structure — EV Charging Infrastructure
- Figure 2: Market Size and Forecast Framework — EV Charging Infrastructure
- Figure 3: Value Chain and Ecosystem Analysis — EV Charging Infrastructure
- Figure 4: Market Dynamics — Drivers, Restraints and Opportunities — EV Charging Infrastructure
- Figure 5: Segment Contribution Analysis — EV Charging Infrastructure
- Figure 6: Regional Market Landscape — EV Charging Infrastructure
- Figure 7: Country-level Opportunity Mapping — EV Charging Infrastructure
- Figure 8: Competitive Positioning Matrix — EV Charging Infrastructure
- Figure 9: Market Share of Leading Players — EV Charging Infrastructure
- Figure 10: Adoption and Penetration Trends — EV Charging Infrastructure
- Figure 11: Technology and Innovation Landscape — EV Charging Infrastructure
- Figure 12: Pricing and Business Model Analysis — EV Charging Infrastructure
- Figure 13: Investment, Funding and M&A Landscape — EV Charging Infrastructure
- Figure 14: Regulatory and Policy Framework — EV Charging Infrastructure
- Figure 15: Porter's Five Forces Analysis — EV Charging Infrastructure
- Figure 16: PESTLE Analysis — EV Charging Infrastructure
- Figure 17: Growth Opportunity Heat Map — EV Charging Infrastructure
- Figure 18: Future Outlook and Strategic Roadmap — EV Charging Infrastructure
List of Tables
- Table 1: Market Segmentation Overview — EV Charging Infrastructure
- Table 2: Segment Definitions and Scope — EV Charging Infrastructure
- Table 3: Regional and Country Coverage Summary — EV Charging Infrastructure
- Table 4: Key Company Profiles and Offerings — EV Charging Infrastructure
- Table 5: Competitive Benchmarking Matrix — EV Charging Infrastructure
- Table 6: Product and Service Portfolio Mapping — EV Charging Infrastructure
- Table 7: Market Drivers, Restraints and Trends — EV Charging Infrastructure
- Table 8: Strategic Initiatives and Developments — EV Charging Infrastructure
- Table 9: Partnerships and Collaborations — EV Charging Infrastructure
- Table 10: Research Assumptions and Limitations — EV Charging Infrastructure
- Table 11: Data Sources and References — EV Charging Infrastructure
- Table 12: Report Scope and Coverage Summary — EV Charging Infrastructure
A look at the pages.
88 pages · 20 sections · charts & tables
A genuine peek at the opening pages. Unlock to read every page in full.


6 of 88 pages shown
Turn this market into a plan for your business.
Answer a few quick questions and unlock a personalised operational read — your maturity score, prioritised focus areas and quick wins — mapped to where this market is heading. Result delivered instantly and emailed to you.
- Maturity score & prioritised focus areas
- Practical quick wins and a recommended next step
Questions, answered.
How big is the Global EV Charging Infrastructure Market?
Nexvora models the Global EV Charging Infrastructure Market at approximately USD 45–50 billion. Full market sizing, segmentation and forecasts are inside the report (modeled estimate).
What is the growth rate (CAGR) of the Global EV Charging Infrastructure Market?
The Global EV Charging Infrastructure Market is projected to grow at a CAGR of about 20–24% over the forecast period — a Nexvora modeled estimate detailed across the report's 20 sections.
What does this report include?
A complete market intelligence report — market sizing and forecasts, segmentation, regional and industry analysis, competitive landscape, trends, and strategic recommendations across 20 sections.
How do I access it after purchase?
Instantly, in your secure online viewer. Reports are view-only and available on any device from your library.
Are the figures sourced?
Quantitative figures are Nexvora modeled estimates unless explicitly cited to a referenced source within the report.
Can I buy access for my team?
Yes — add user seats at checkout, or subscribe for bulk access across multiple reports.
Nexvora Intelligence research report. All quantitative figures are modeled estimates — not audited data. Not financial or investment advice.
More market reports
Keep exploring intelligence in this and related sectors.

Global Data Center Power & Liquid Cooling Infrastructure Market — Accelerated Compute, Grid Constraints & Thermal Management Outlook

Beyond the Grid: Space-Based Solar Power — Strategic Intelligence Report

Global Direct Air Capture, Durable Carbon Removal Offtakes and MRV Infrastructure Market — Intelligence Report